GlobalBankingResearch:countryspecifics&stockpicks
炒股就看金麒麟分析师研报,权威,专业,及时,全面,助您挖掘潜力主题机会!
重要提示:通过本订阅号发布的观点和信息仅供中信建投证券股份有限公司(下称“中信建投”)客户中符合《证券期货投资者适当性管理办法》规定的机构类专业投资者参考。因本订阅号暂无法设置访问限制,若您非中信建投客户中的机构类专业投资者,为控制投资风险,请您取消关注,请勿订阅、接收或使用本订阅号中的任何信息。对由此给您造成的不便表示歉意,感谢您的理解与配合!
Table of contents
Introduction and key summary
I. Country analysis: key comp metrics and further breakdowns II. Growth markets: country specifics and stock selections
III. Dividend markets: a bottom-up approach
IV. Balanced markets: high-growth and dividend picks
V. Some cross-overs: high-growth and positive guidance in dividend markets
VI. Final top-pick list and two more issues: valuation and FX
Introduction and key summary
Why we cover global banks?
This is the initiation note of our global bank coverage, and a starting point for our systematic research to follow good banks globally.
Global banking investment is operationally feasible and strategically effective, because
Banks have similar business models around the world. Banks from very different countries could be evaluated within a consistent analytic framework and directly comparable. This means operational feasibility.
Banks serve corporates and individuals in single or several countries, a few of them are global. They are the natural representatives of their markets. This means beta.
But banks are more than betas of their local economies, due to various levels of managerial capabilities out of different governance structures. Some of them do outperform their economies through cycles. This is alpha.
Finally, markets across the world have differentiated economic cycles, business environment, social structures, and culture. This means potential for trans-regional and intertemporal allocation.
Investments in banks globally can provide investors with returns from a good combination of growth and dividend, while smooth fluctuations by avoiding over-concentrations on single-market and single-style risks.
In this note, we establish our framework for global banks analysis, and target to be comprehensive and accurate, yet straightforward and concise enough with good practicality.
A preliminary top-pick list of banks to follow has been proposed for future study.
Current view on global banks: higher terminal policy rate & abetter future
The incoming policy rate cut cycle is overall positive for banks: against the traditional view that banks love high interest rates, they are eager for rate cuts indeed. Because the current high interest rate greatly dampens borrowing needs. It is even negative for NIM as deposit passthrough continues to pick up and banks cannot charge more on loans as policy rate does not increase further. With most of rate exposures hedged throughout next 2-3 years, banks are well prepared for the negative short-term impact on NIM from rate cuts and happy to see a rebound in borrowing needs, a turnaround in passthrough and a pickup in wealth management fee generations, after the rate cuts. Such positive effects, together with the hedges, are more than offset the negative NIM impact.
The terminal interest rate after the rate cut cycle is the most important factor for banks’ performance globally: after the relatively peaceful navigation through the rate cut cycle next 2-3 years, the terminal interest rate is the most important factor for banks’ performance in the long run. Banks need some rates to operate, banks do not live well in zero-rate environment.
The terminal interest rate is likely to be higher than the post-covid level and will not go back towards zero, due to totally different international environment as the fragmentation of global supply chains, heavy investments on new technology like AI and green energy, all of which are inflationary and point to higher policy rate.
Such a higher terminal rate will be the sweet spot for banking business and we expect a better environment for banks globally thereafter: when the terminal rate finally settles at around 3% as expected, it means an ideal environment for banks: enough room for loan price and investment yield, vibrant borrowing needs and business activities and good asset quality.
What banks we cover & how we analyze them?
What do we study? Over 1,000 banks from 38 regions, out of the entire global banking universe based on criteria of size, PB and stock performance.
Asia: India, Vietnam, Indonesia, Malaysia, Thailand, Singapore, Saudi Arabia, UAE, Qatar, Kuwait, Turkey, South Korea, Japan, China Hong Kong, China Taiwan
Africa: Egypt, South Africa
South America: Brazil, Chile, Argentina
North America: US, Canada, Mexico
Europe: UK, France, Germany, Netherlands, Belgium, Switzerland, Austria, Sweden, Spain, Italy, Poland, Czech, Hungary, Croatia
Oceania: Australia
How do we conduct our research?
We use DuPont analysis as the first step to align banks on a comparative basis on four pillars: growth, revenue quality, operational efficiency, asset quality.
Then dig deeper into revenue structures, including A/L yields, fee income sources, non-NII components, Opex and asset quality dynamics, to judge outlooks and sustainability of key indicators in DuPont.
We also look for specific business and organizational advantages, if any, driving such good financials.
Finally, we converge the details above into PB-ROE framework, with dividend outlook, to make our stock picks.
We also draw some lessons for Chinese banks, as a reference.
A quick summary of growth vs. dividend across regions
Good banks thrive in fast-developing regions, best banks outperform their own environment. That’s why it’s easy to pick out high-growth banks in developing economies, but there are also plenty of high-growth banks, besides pure dividend pick, from developed countries in our watch list.
We define three groups of regions: growth, dividend and balanced, and conduct our research on different ways for banks in each type of regions. Our stock picks are divided into two types of banks: growth and dividend.
Banks in developing countries are best picks from the growth perspective. The most attractive regions are India, Vietnam, Indonesia, Turkey, Mexico, Eastern Europe. There are also outstanding growth banks on a bottom-up perspective in other countries. A special attention on inflation should be paid to separate organic growth from inflation-led ROE expansions.
Banks in US, Brazil, Saudi, UAE, Qatar, Malaysia, South Africa strive a good balance between dividend and growth. These regions have both high-quality growth banks and dividend banks.
Bank from Developed Western and Northern Europe, Canada and Australia are mostly dividend oriented. There are also some banks with outstanding growth potentials.
Lessons for Chinese banks
NIM is very important for banks, not only as a key driver for high growth, but also a definitive factor for banks’ attitude towards active risk bearing.
We’ve seen many regions of banks with extremely low NIMs for a long time like Japan and some developed European countries, banks are not bound to die in such low margin environment.
But they all tend to be highly conservative by keeping everything as low as possible, such as loan and deposit pricing, loan growth, NPL, credit cost, etc.
And rely heavily on financial market business, bringing more vulnerability during extreme market conditions.
Even for the purpose of banks must serve the economy, such lowly-laid banks should hardly be viewed as doing good jobs. Keep banks away from the long-last low margin trap is critical.
Fee business is luxury, bigger banks usually have bigger advantages.
Only banks in a few regions with advancedfinancial market or global trade center have fee shares in revenue consistentlyover 30-40%. 10-20%fee contribution is the common reality for banks in most regions.
Many important fee sources are prohibited for Chinese banks such as account and transaction related fees due to fee reduction requirement, investment banking and asset management fees under separate operation.
Big international income contribution is only achievable for big banks from countries either with world dominance (US), historical heritage (UK) or cross-border M&As (Japan).
Dividend and growth are inherently connected. If stagnating growth and downward ROE trend persist for long, dividend will diminish after all.
Ⅰ
Country analysis: key comp metrics and further breakdowns
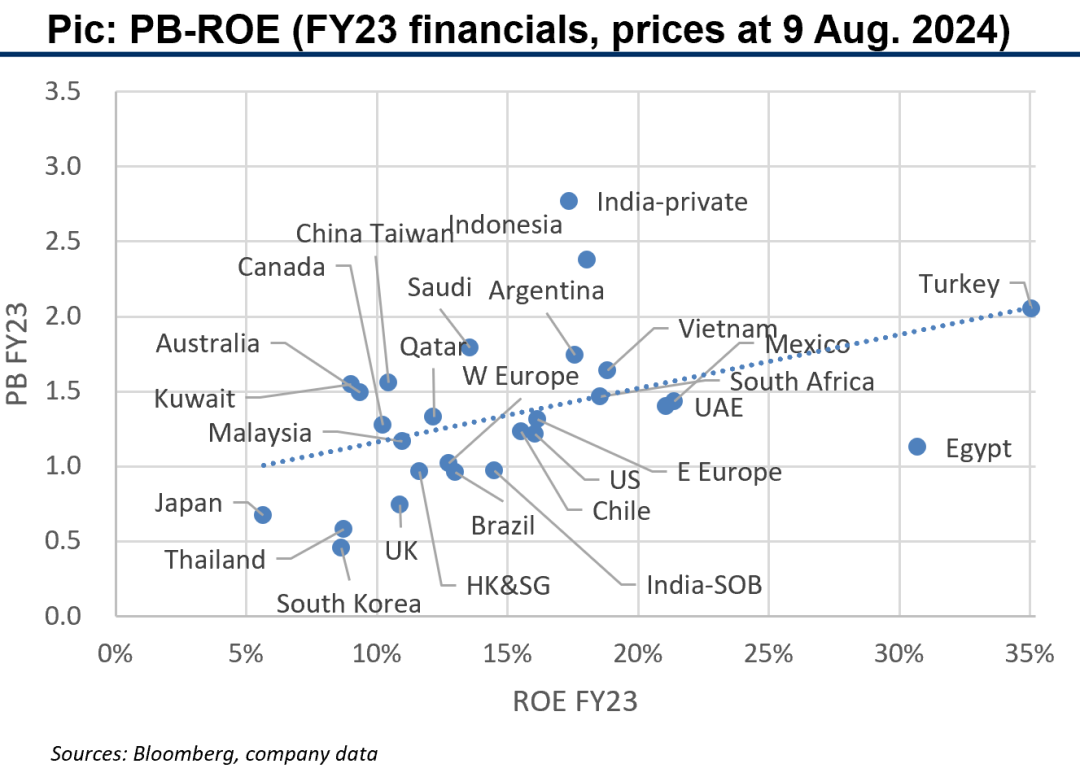
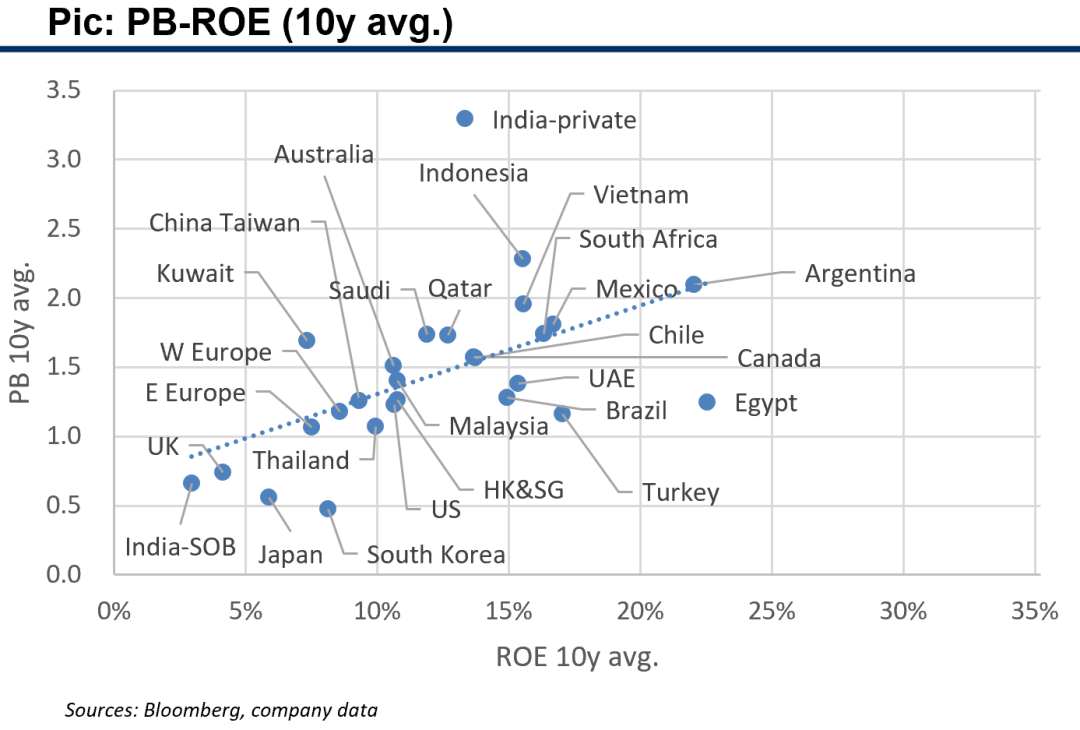
1. Key comp metrics: PB-ROE
We calculate regional averages based on the top 10 or top 5 local banks, extreme or very small numbers are not included.
Selected banks’ overall valuation as of 9 August 2024 is lower than 10-year average.
Regions with gains in both ROE and valuation: Turkey, India-SOB, Eastern Europe.
Regions with improvements in ROE but limited gains in valuation: Egypt, India-private, US, UAE, Mexico, Vietnam, Indonesia, UK, Western Europe, South Africa, Chile.
Regions with stable ROE but stable or retreated valuation: Saudi, Brazil, Qatar, Malaysia, HK&SG.
Regions with retreats in ROE and valuation: Argentina, Canada, Australia, Thailand.
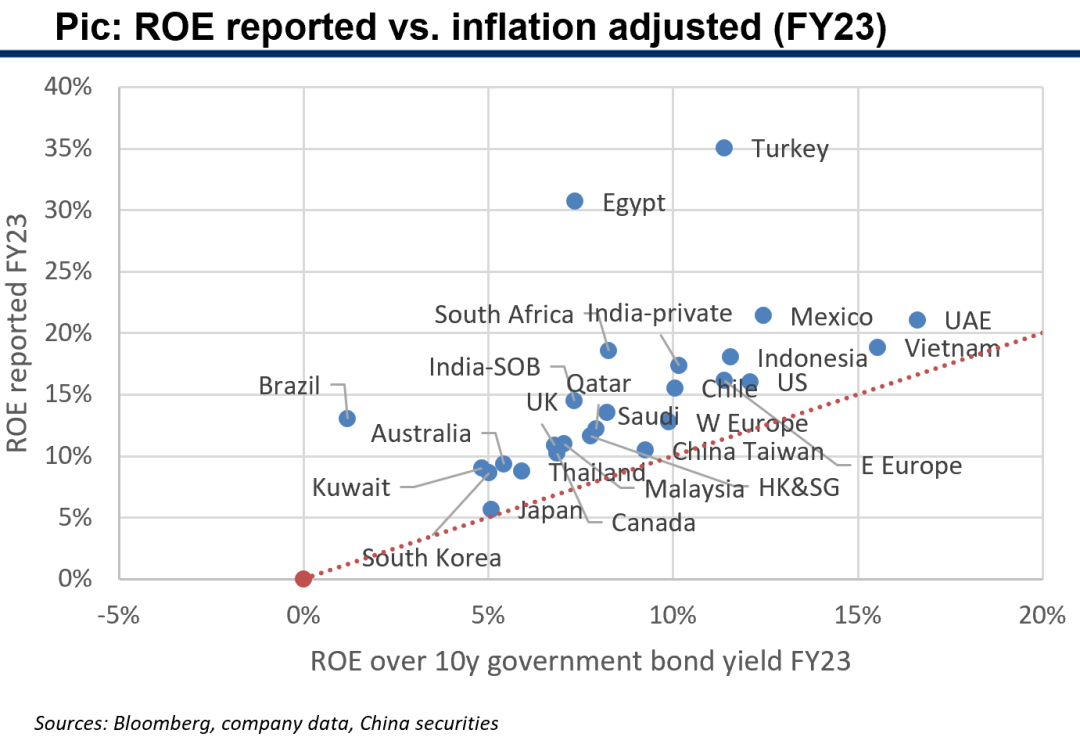
1.1 But after considering inflation...
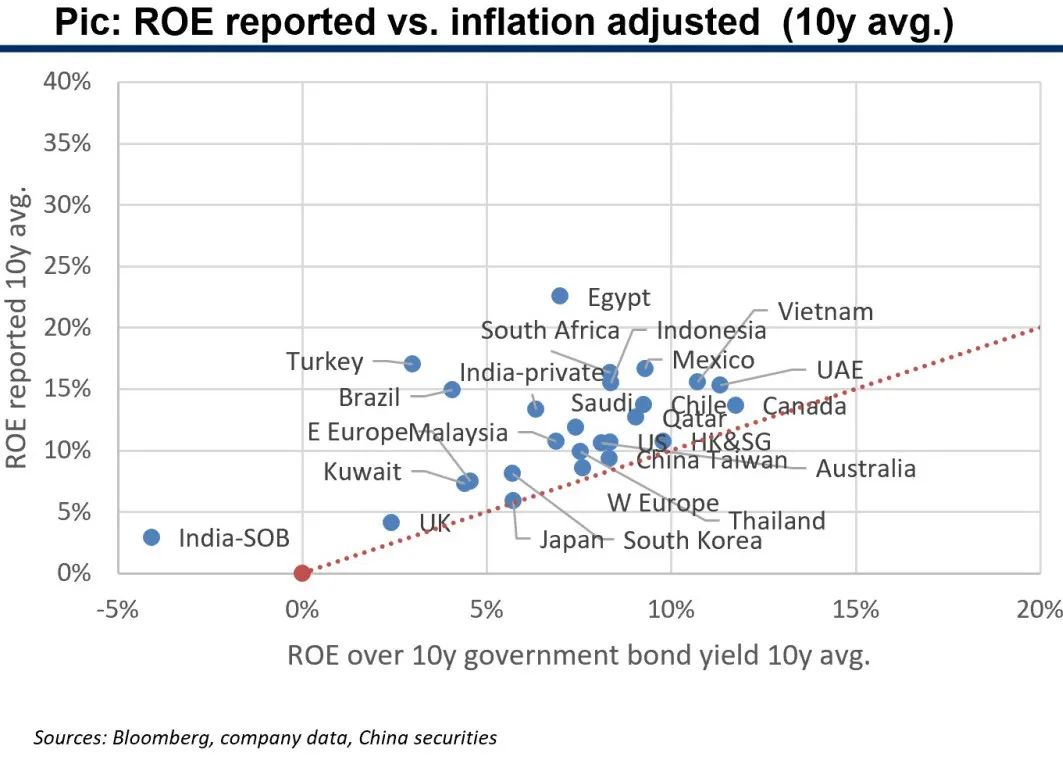
Normally, we don’t need to consider the inflation-adjusted ROE for banks. But given the current high inflation situation in some countries, we compare reported and inflation-adjusted ROEs to separate real ROE changes out of inflation impacts. 10y government bond yield is used as a proxy for inflation.
The further away from the red dashed line in the following charts, the bigger the impact from inflation.
Inflationary impacts on banks’ ROEs are mild in most countries, for both ST and LT. For FY23, Egypt and Turkey are the two regions with biggest inflation impacts. But Turkey banks have remarkable real ROE improvement over past 10 years, while Egypt banks do not. Banks in UAE, Vietnam, Mexico, Indonesia, India, Eastern Europe also have obvious real ROE increases.
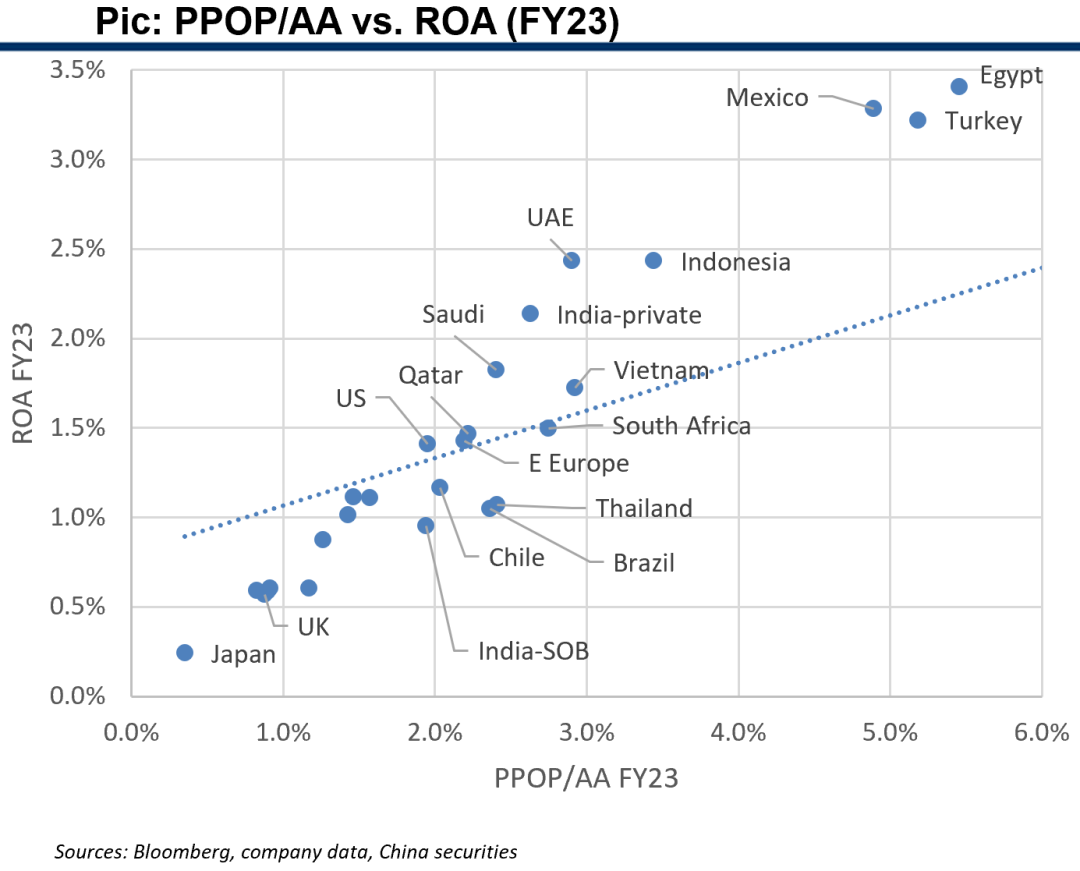
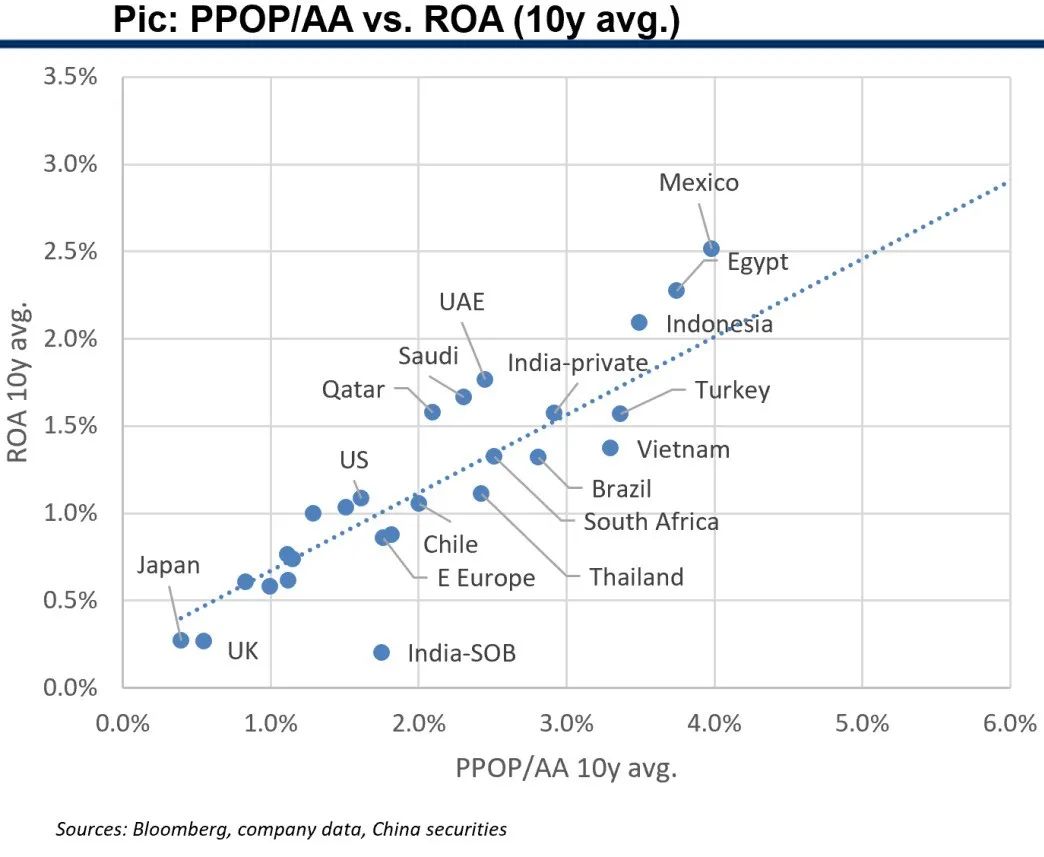
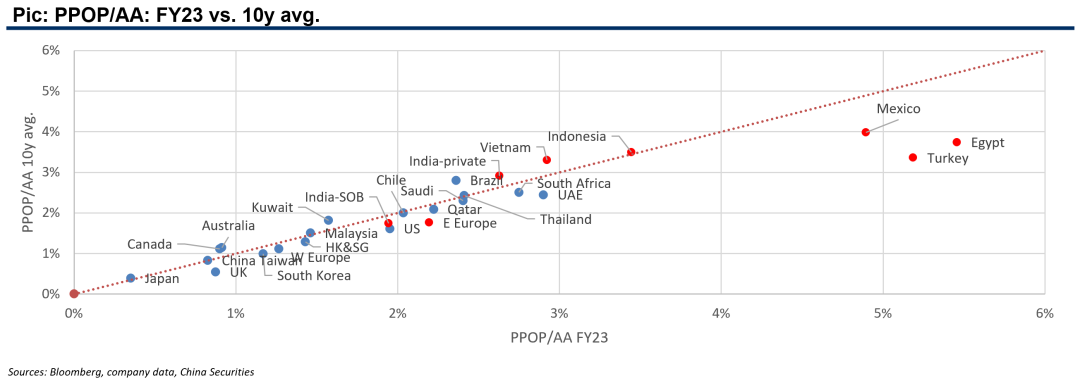
1.1 Key comp metrics: growth
We define 3% PPOP/AA (average assets) as the threshold for high-growth banks, 2-3% as good-growth banks.
Banks with big improvements in both PPOP/AA and ROA in past 10 years: Turkey, Egypt, Mexico, Eastern Europe, UAE, UK, India-SOB.
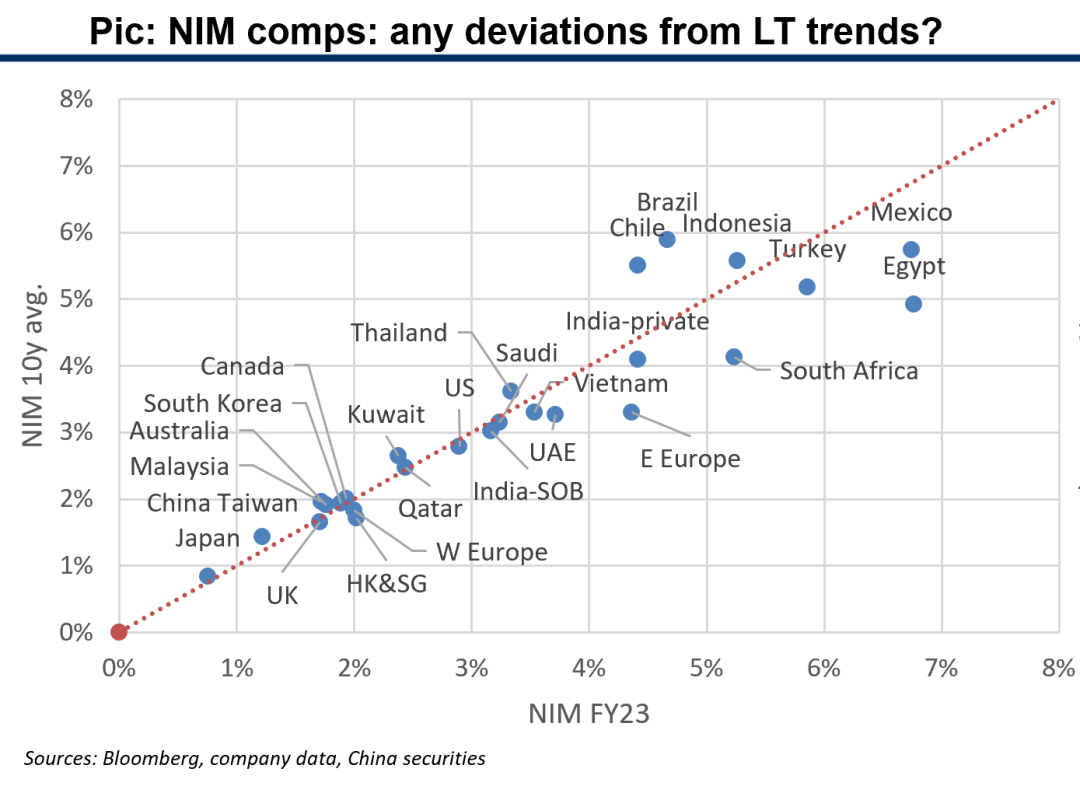
1.1 Key comp metrics: revenue quality
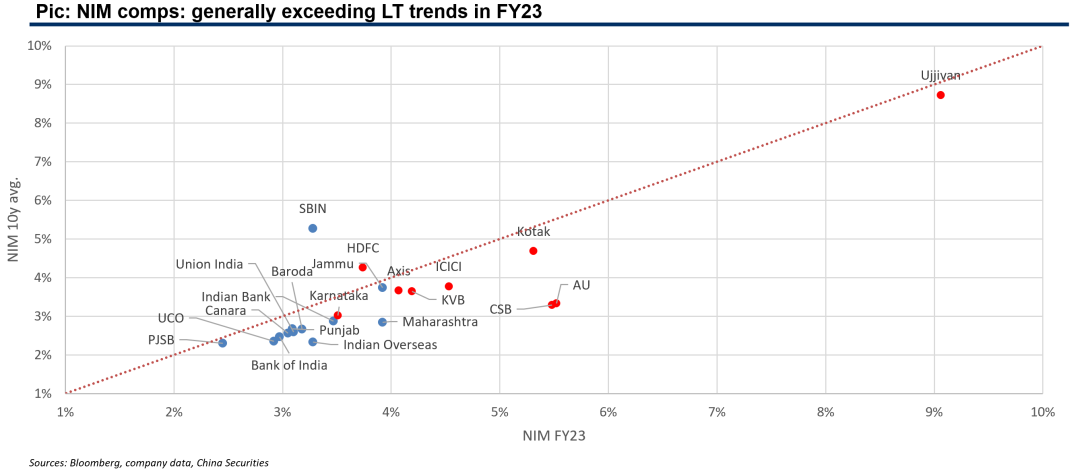
We compare NIMs in a certain year with LT trends to detect any ST over-stretches or lags. Albeit the high rate environment, FY23 NIMs are generally in line with LT trends, showing no signs of over-stretches for future potentials.
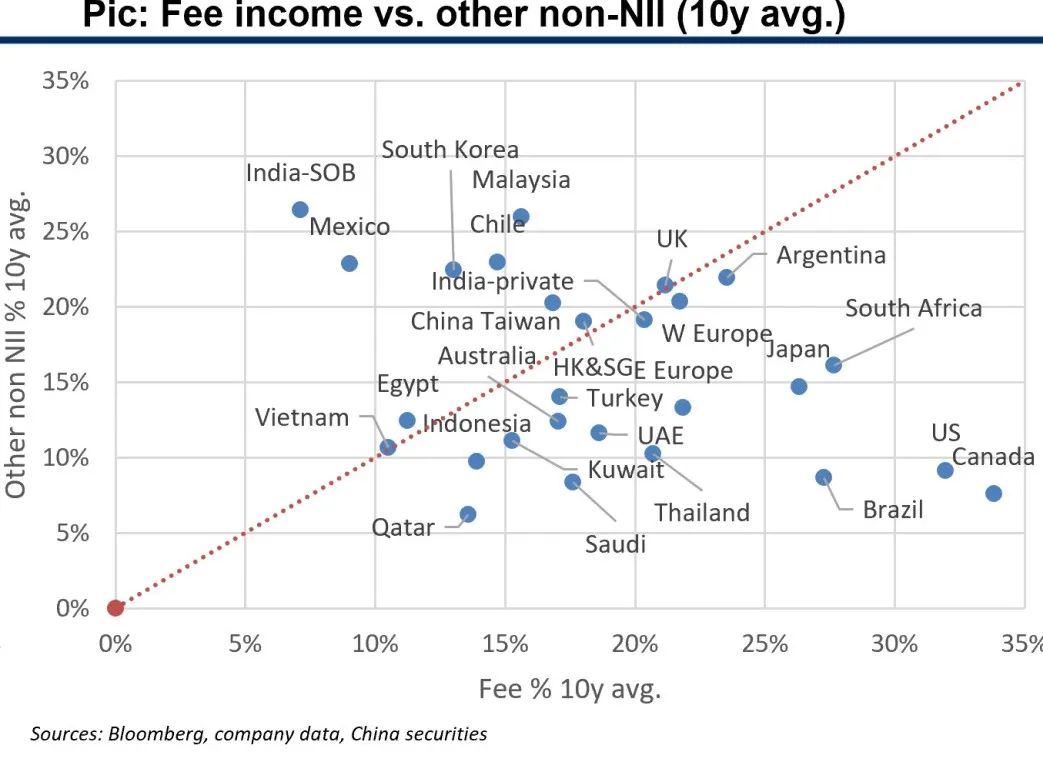
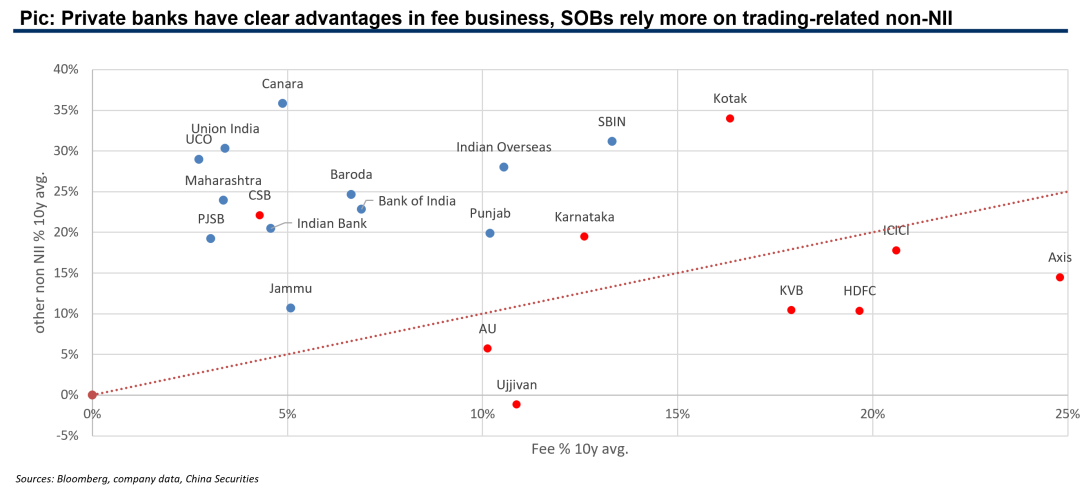
Generally speaking, the more reliance on fee income instead of other non-NII such as trading income, the healthier a bank’s non-NII quality. Banks in developed markets have better non-NII structure with higher shares of fee income.
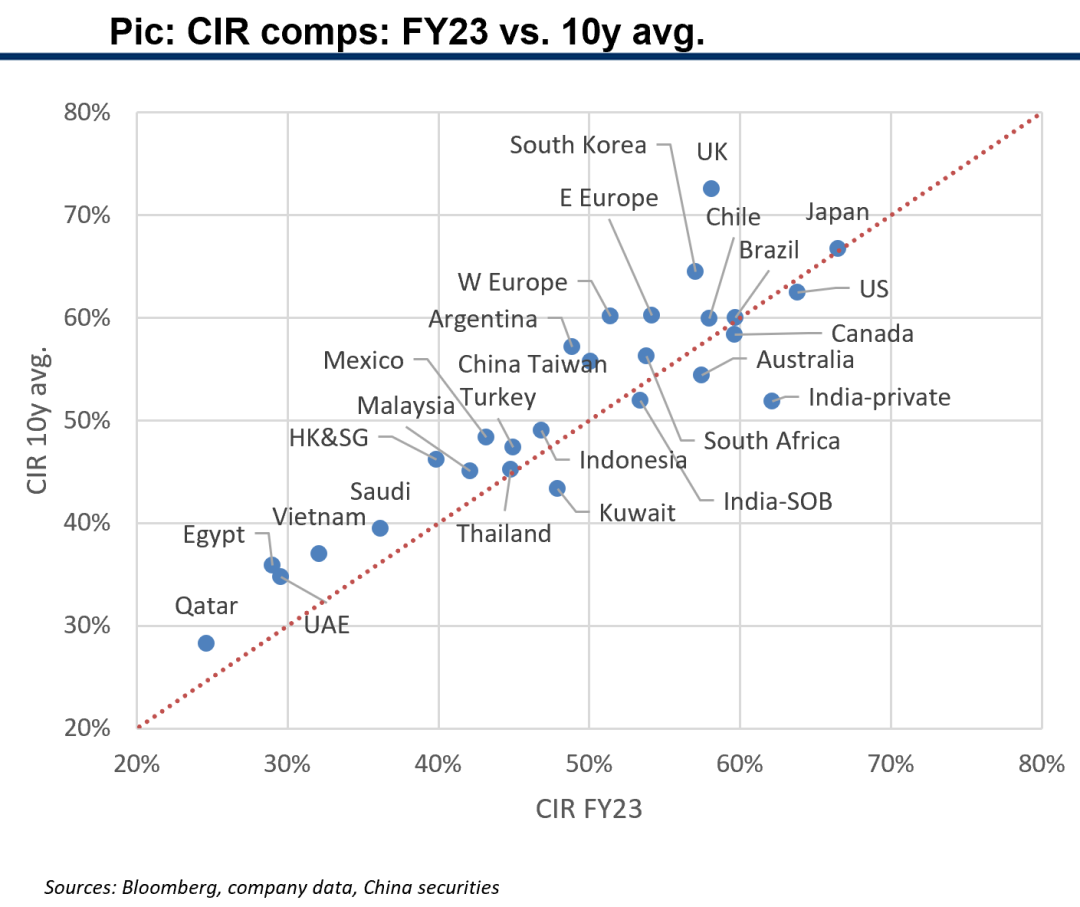
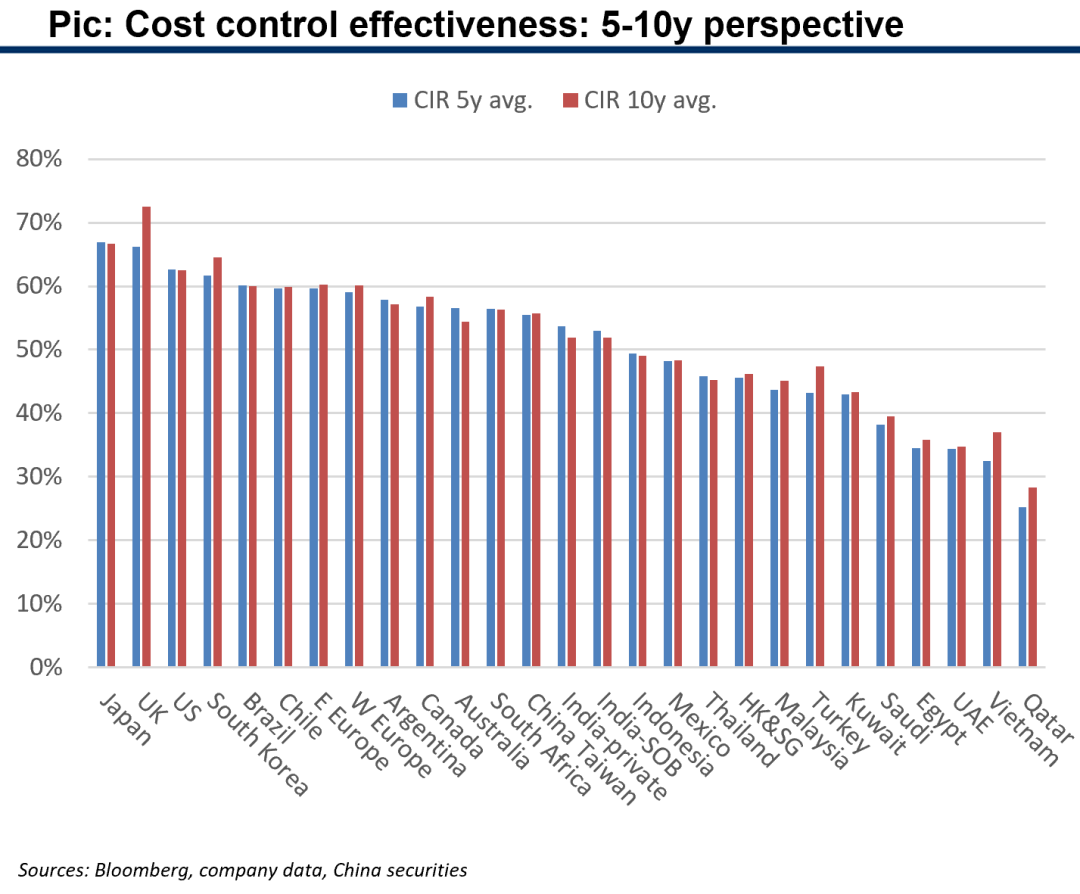
1.1 Key comp metrics: operational efficiency
We compare cost-income ratios in a certain year with LT trends, and LT trends with different lengths, to see if any deviations and progresses in cost controls.
Banks in UK, South Korea, Turkey and Vietnam achieved best cost controls in the past 5 years.
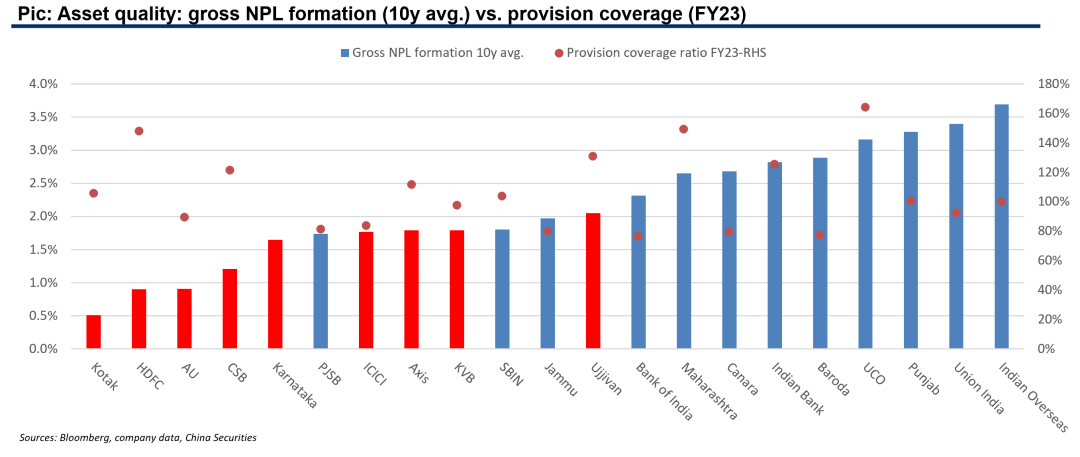
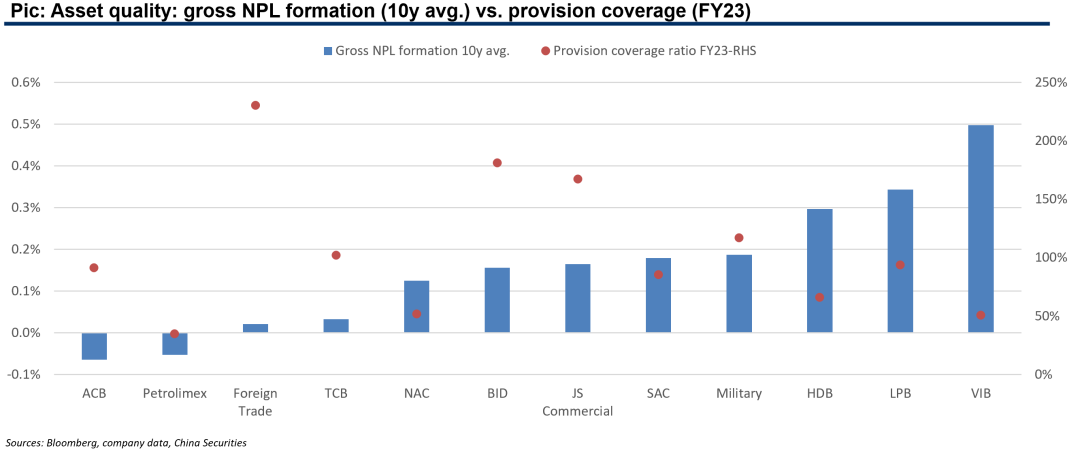
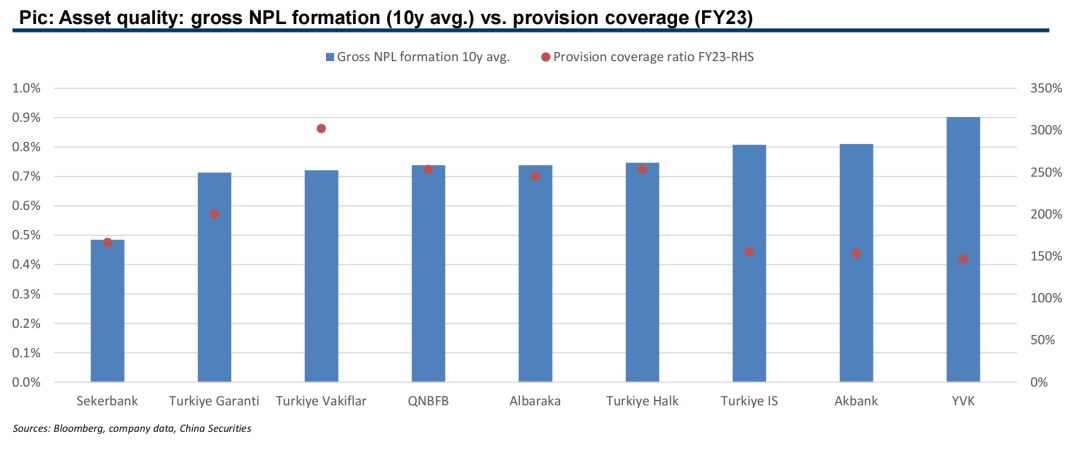
1.1 Key comp metrics: asset quality
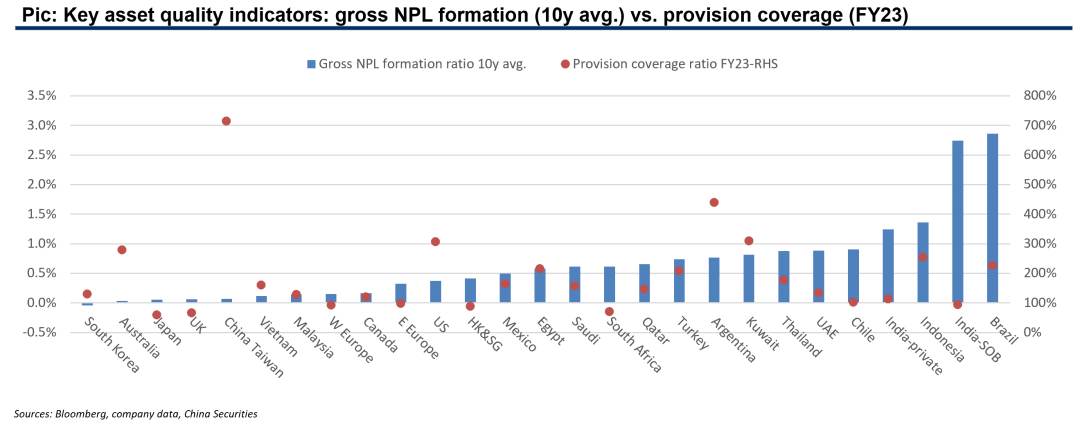
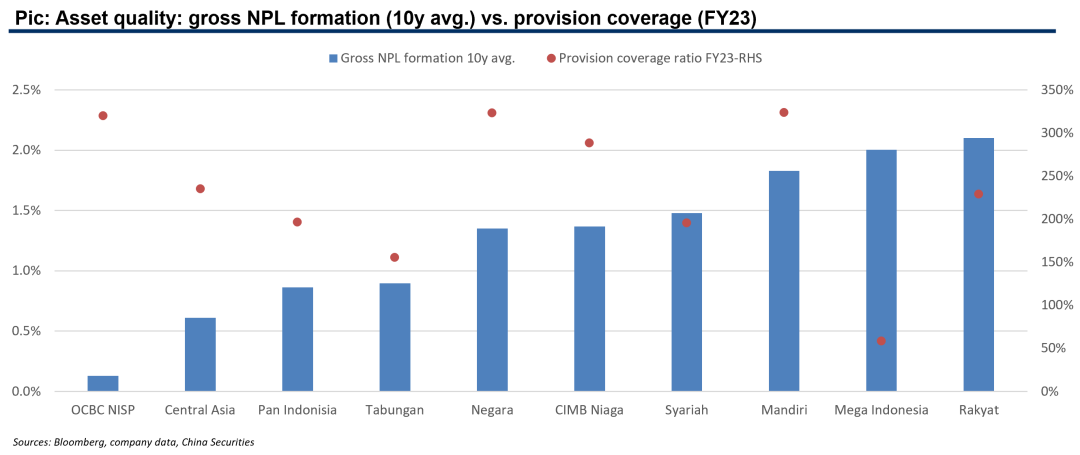
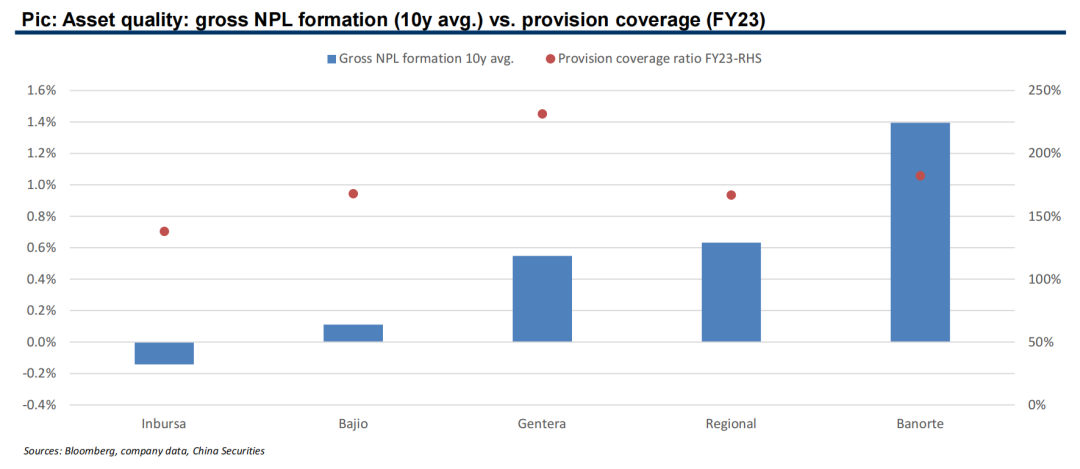
We use 10-year average gross NPL formation ratios (after adding back write-offs) as the key measurement for a region’s LT risk levels of banks’ lending books, and FY23 provision coverage as the cumulative level for risk cushion.
Developing regions generally have higher NPL formations while developed regions normally have lower.
However, provision strategies vary heavily across regions, some are “enough is enough”, tending not to make coverages high, but some are “the higher the better” with very high coverage ratios.
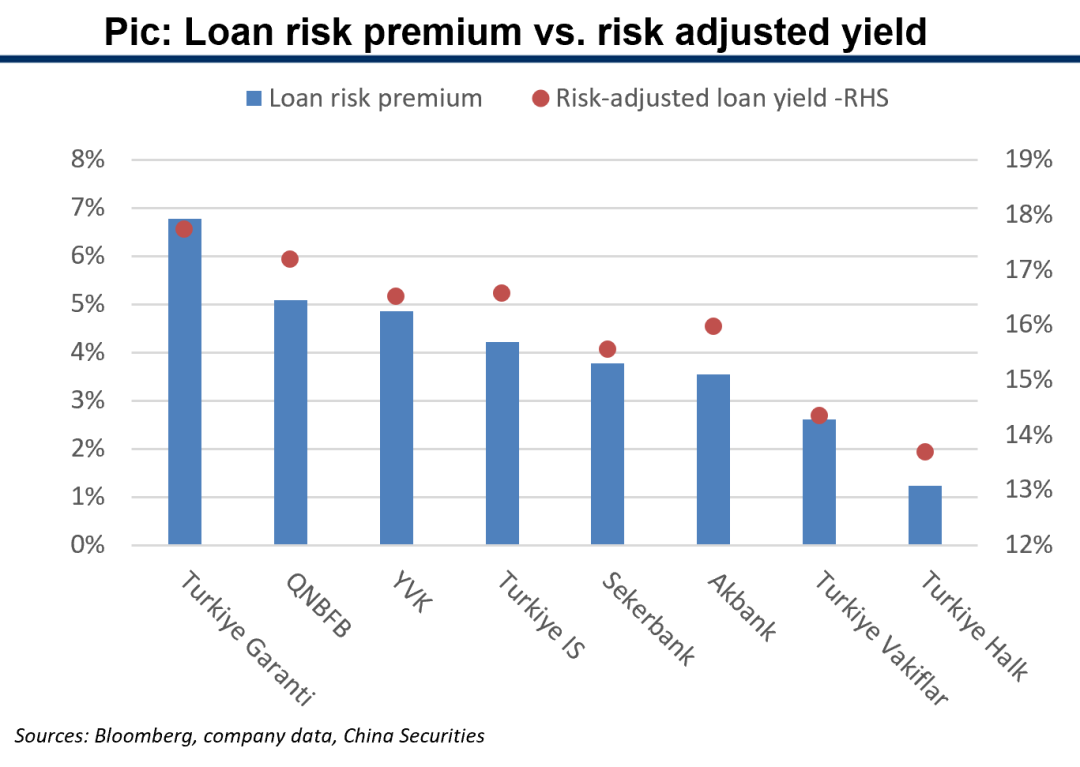
1.2 Loan pricing: which countries have higher risk premiums?
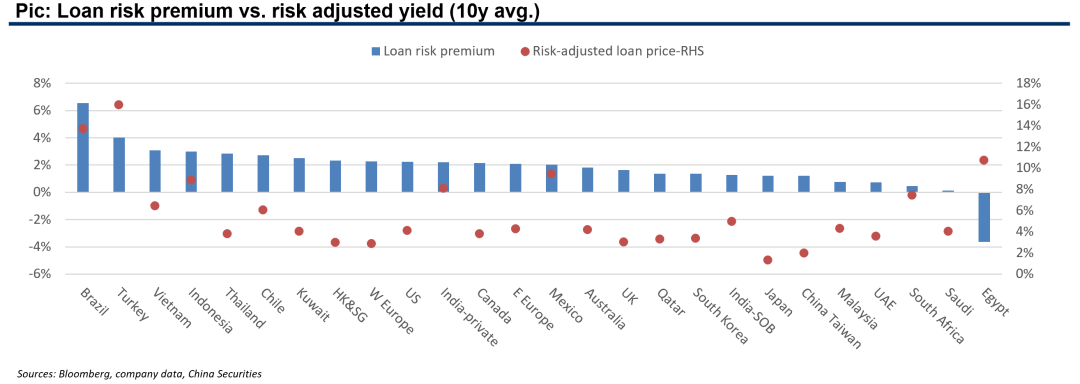
Loan risk premium is loan yield over risk-free rate in the region, risk-adjusted loan price is loan yield over credit cost. uDeveloping markets generally have higher risk adjusted yields and risk premiums.
The difference in rankings of risk premium and risk adjusted yield across regions reflects different risk control effectiveness. Taking Brazil vs. Turkey as an example, Brazil has higher premium but lower risk adjusted yield due to its higher NPL formation (on the previous page).
The negative risk premium in Egypt is a consequence of high inflation.
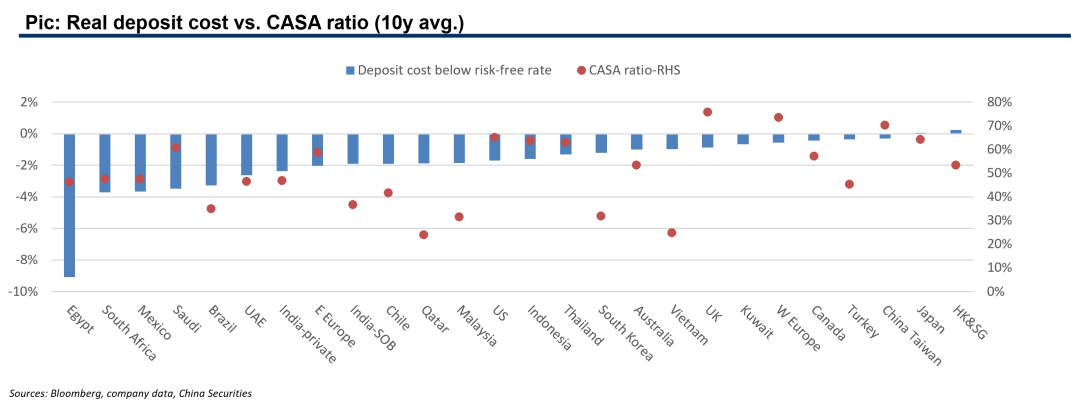
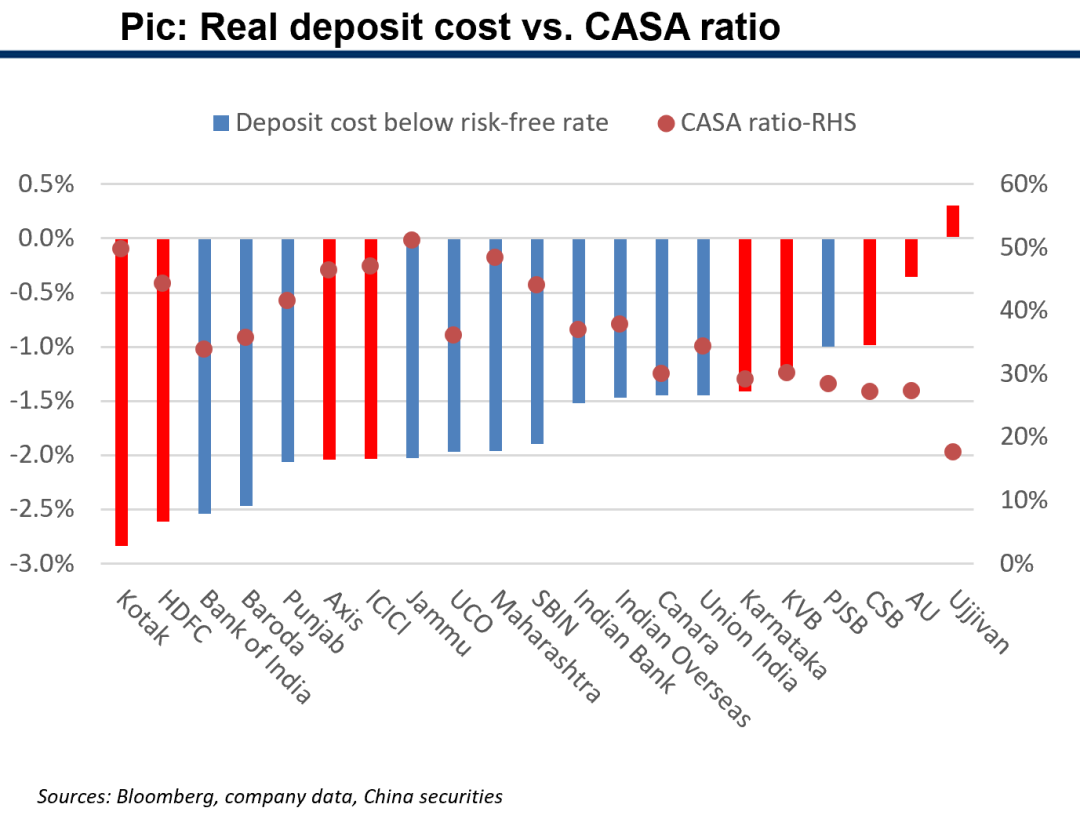
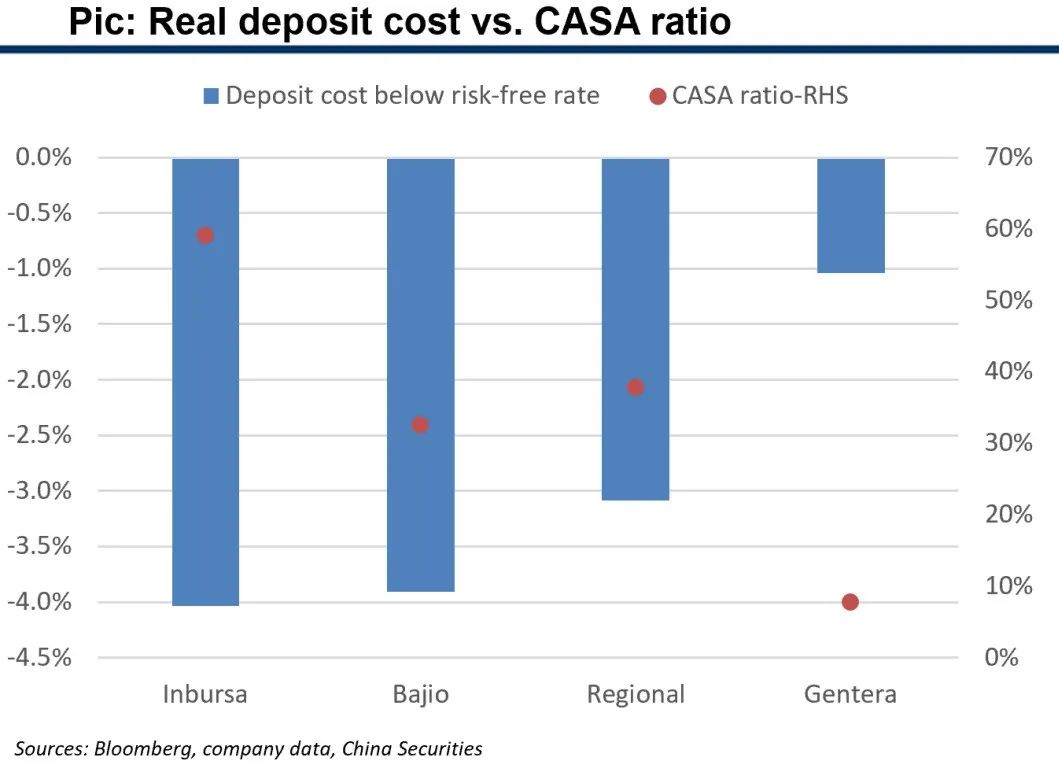
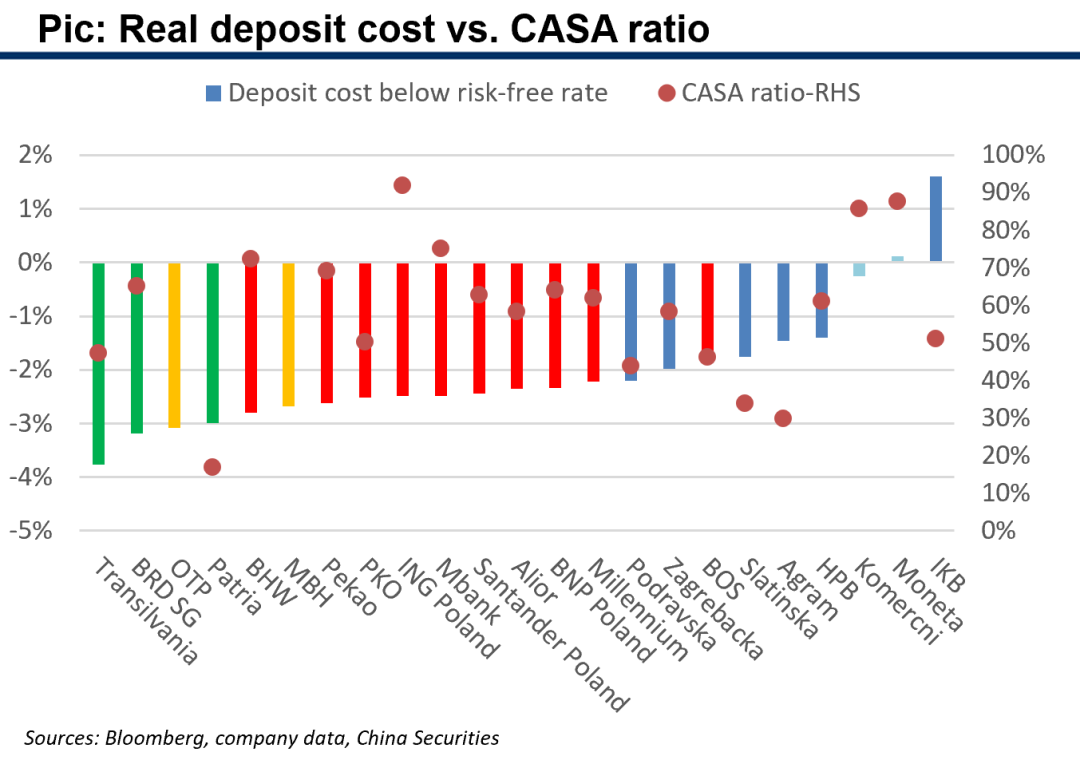
1.3 Deposit cost: which countries have cheapest funding?
Deposit cost below risk-free rate points to a bank’s real funding cost, the lower the better.
Real deposit cost is not associated with CASA ratios in country comps, but within the same country they have clear relationships in some cases.
No clear relationships in real deposit cost and developing market or not.
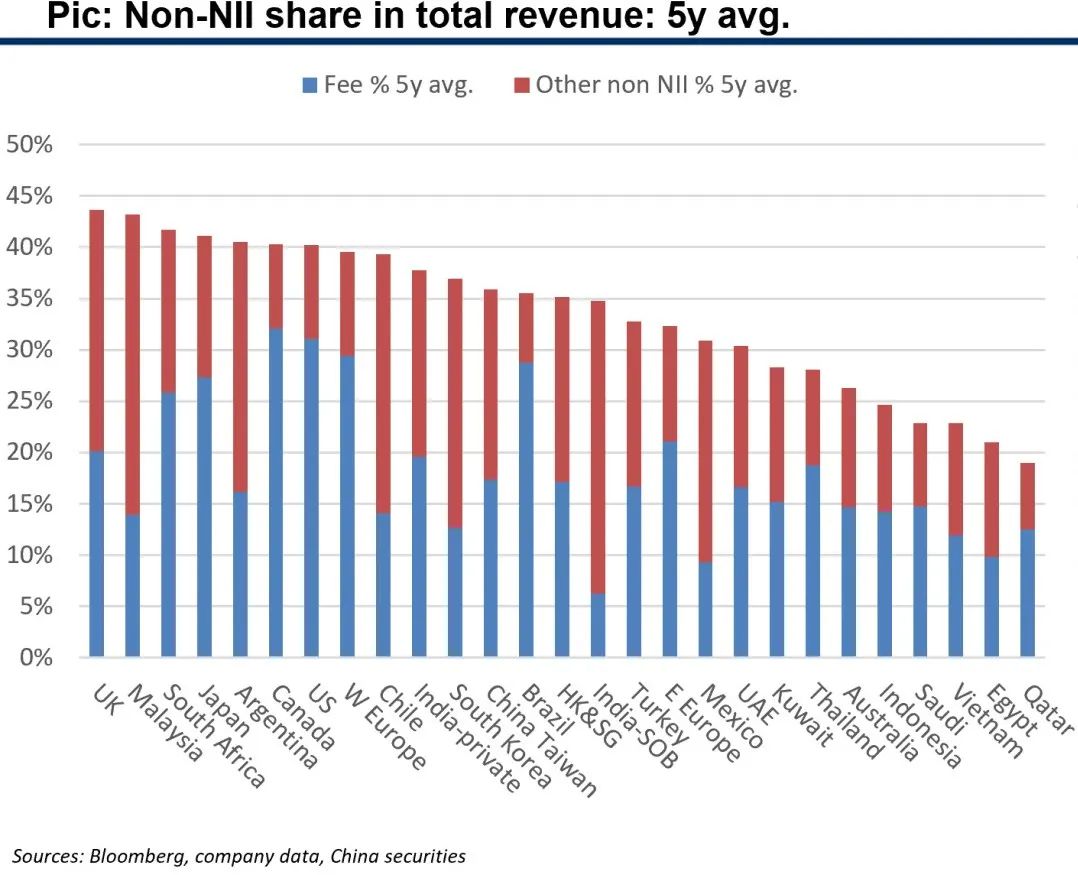
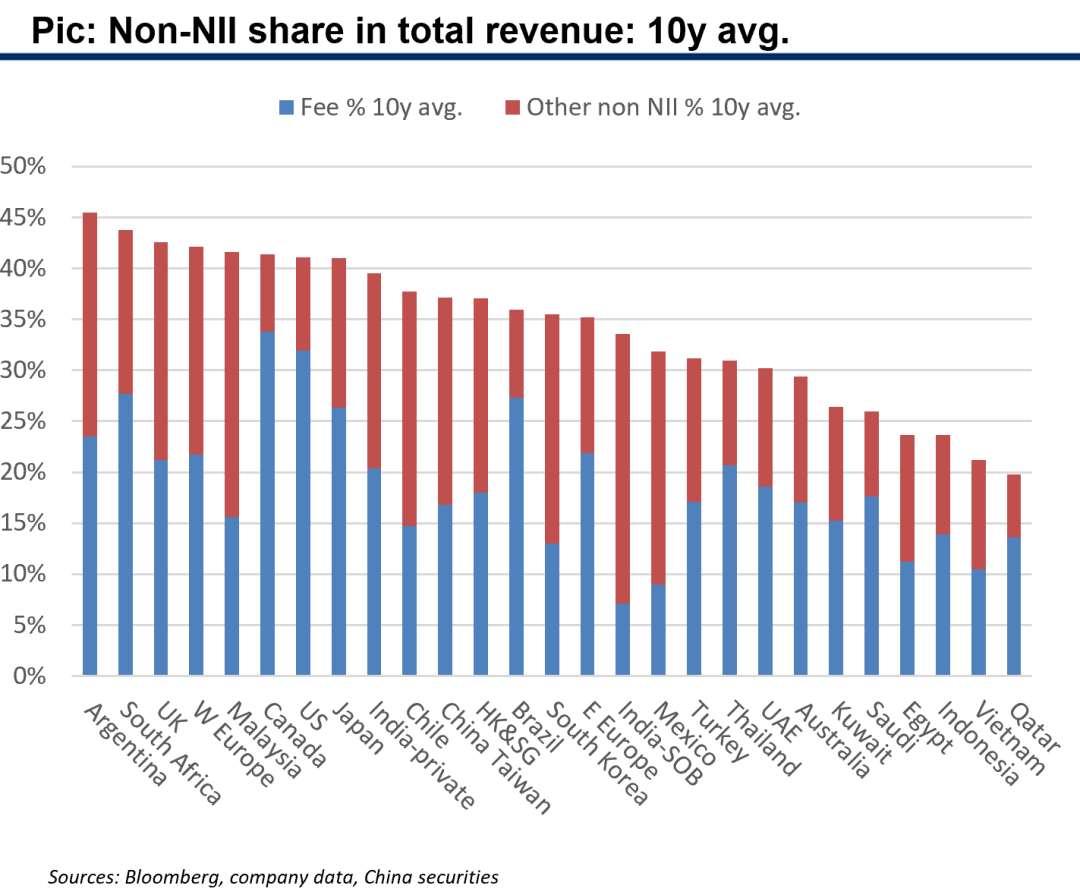
1.4 Revenue structure: non-NII share comps
Banks in developed economies generally have higher fee income contributions rather than trading-generated income in other non-NII, commonly seen in developing market banks.
1.4 Non-NII quality: fee income contributions and structures
Banks across the world generally have weaker recent performances in fee business, with lower fee income shares in total revenue in past 5 years as compared with past 10 years.

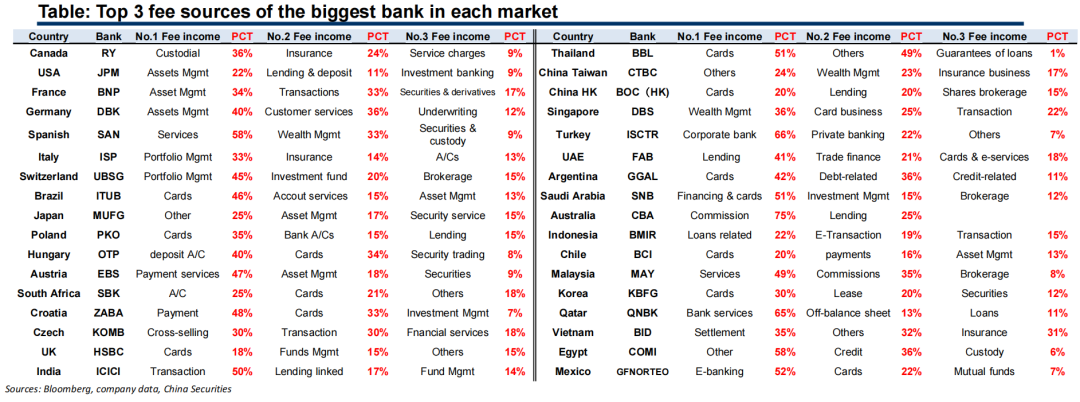
1.4 Non-NII quality: sharp difference in fee structures
Fee business is a luxury business, which need the full support from a country’s inclusive financial system and in-depth capital market.
We list top 3 fee sources of the biggest banks in each market. Banks in developed economies have higher shares from sophisticated fee business like asset management, investment banking, insurance, etc. Banks in developing markets rely more on traditional fee business like payment, cards, account management, lending fees, etc.
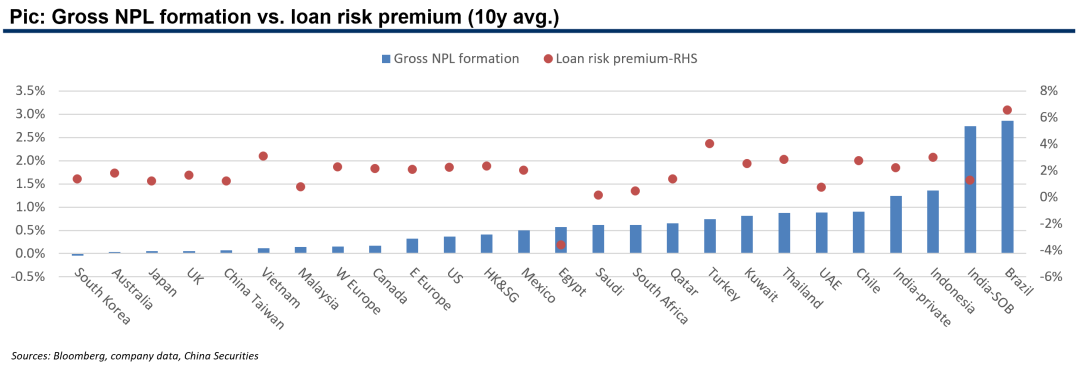
1.5 Asset quality: is a bank’s risk attitude a result of loan pricing?
Loan risk premiums and gross NPL formations are similar for banks in most developed markets. In a highly consistent pattern, regions with lower premiums usually have lower formations, a good reflection of banks’ risk appetite and the stability of banking systems in developed markets.
Banks in developing markets generally have higher premiums and formations than their developed-market peers. Regions with higher premiums normally have higher formations, with some exceptions…
…among developing markets, the combination of low premium and high formation is commonly seen, a typical sign of insufficient loan pricing and risk control in some regions, as well as less stable banking systems.
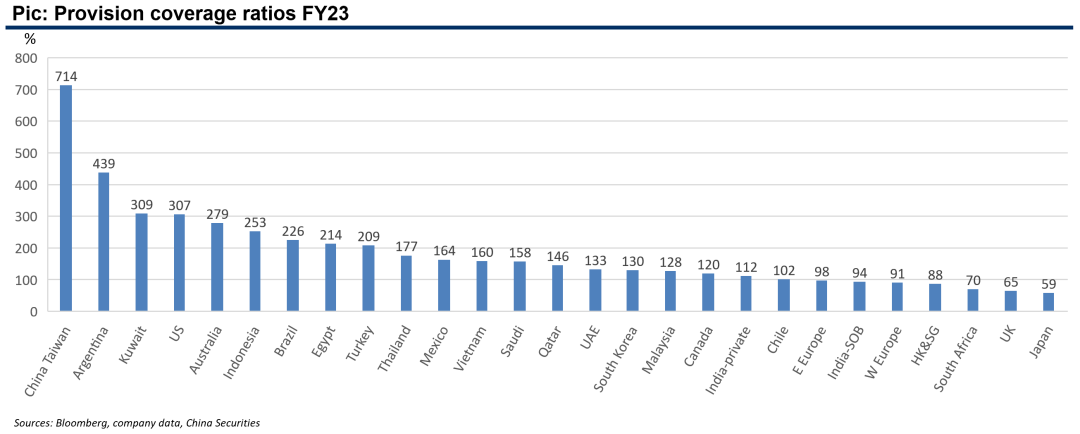
1.5 Asset quality: is a bank’s risk attitude a result of loan pricing?
Banks’ attitudes toward provision coverage are generally consistent in different regions, which are highly different across countries. But bear in mind high provision does not naturally equals to high valuation.
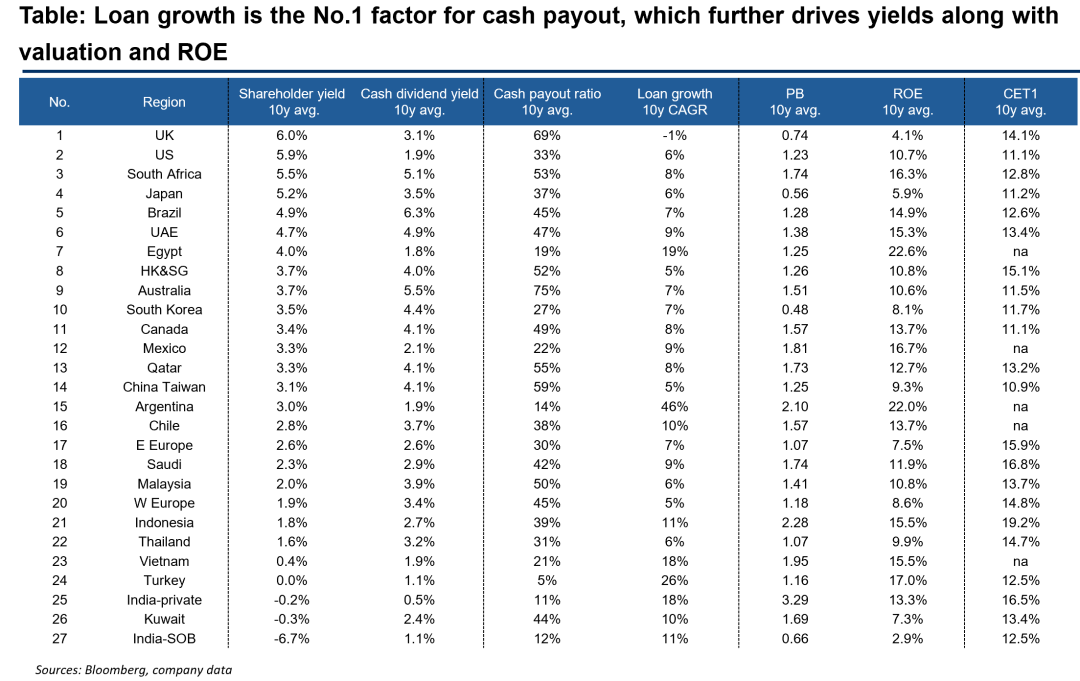
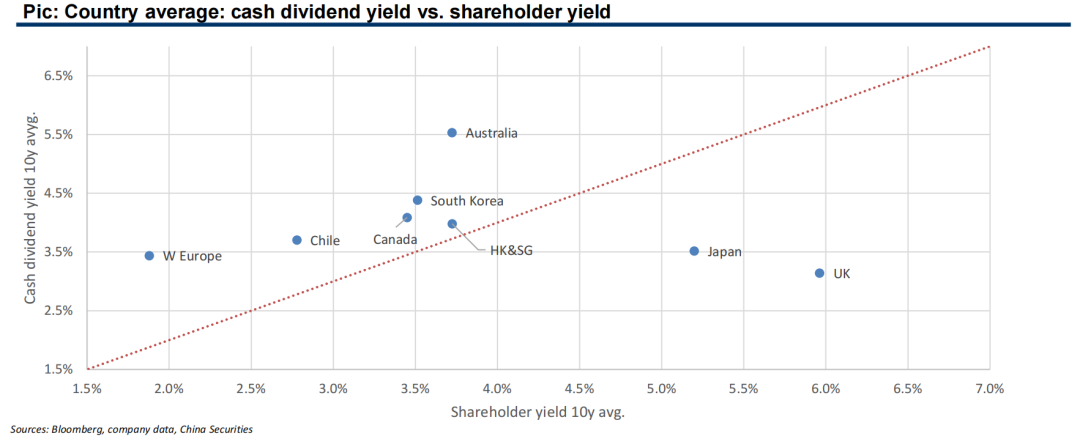
1.6 What drives dividend yield and shareholder yield?
Shareholder yield is cash dividend yield plus any impacts from buybacks (positive) and capital raising (negative).
Table: Loan growth is the No.1 factor for cash payout, which further drives yields along with valuation and ROE
Ⅱ
Growthmarkets: country specifics and stock selections
2. Growth markets: criteria and scopes
For growth markets, average long-term PPOP/AA should exceed or close to our high-growth standard of 3%, or has been increased significantly during a long period of time.
Another typical characteristic of growth market is there must be a considerable amount of banks with PPOP/AA>3% in the long run. Therefore it is common that banks within one same growth market have big variances on growth.
We label the following regions as growth markets and analyze banks there carefully: India, Vietnam, Indonesia, Egypt, Turkey, Mexico, Eastern Europe.
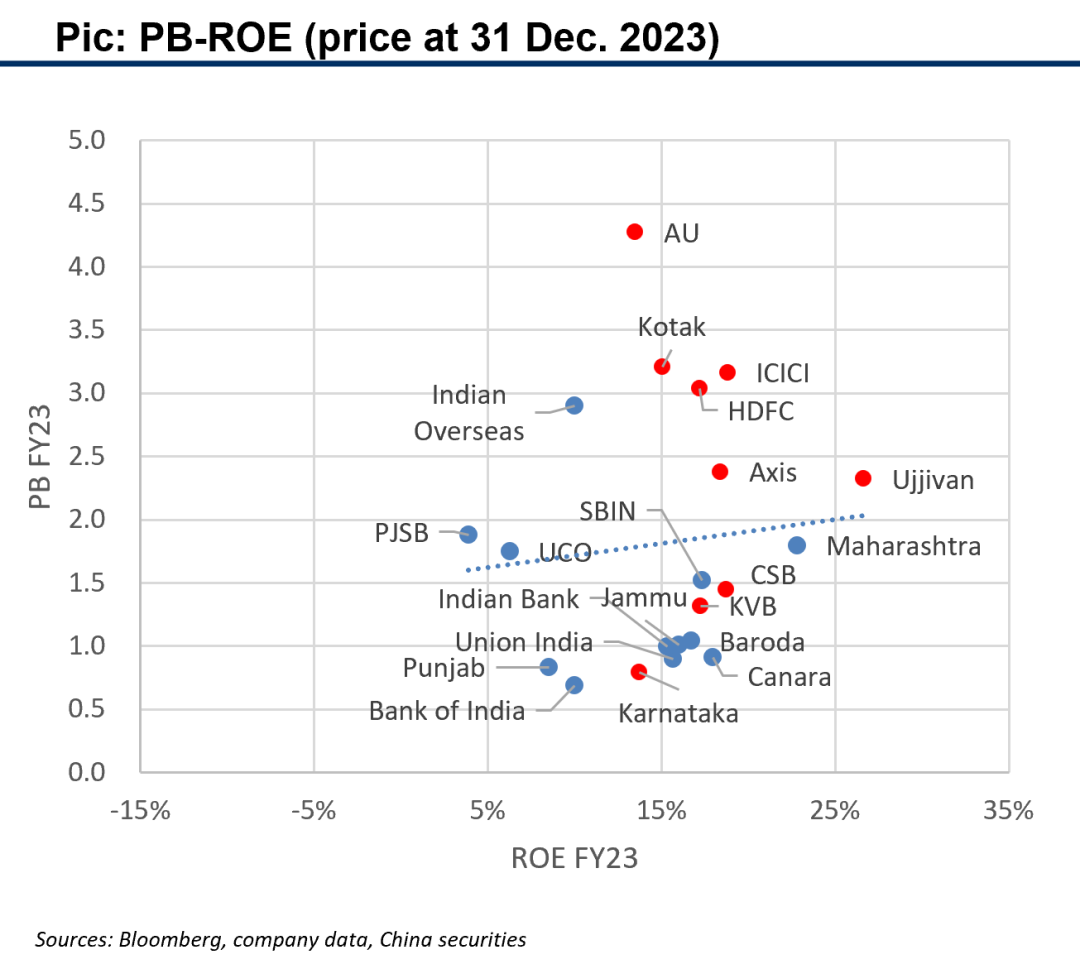
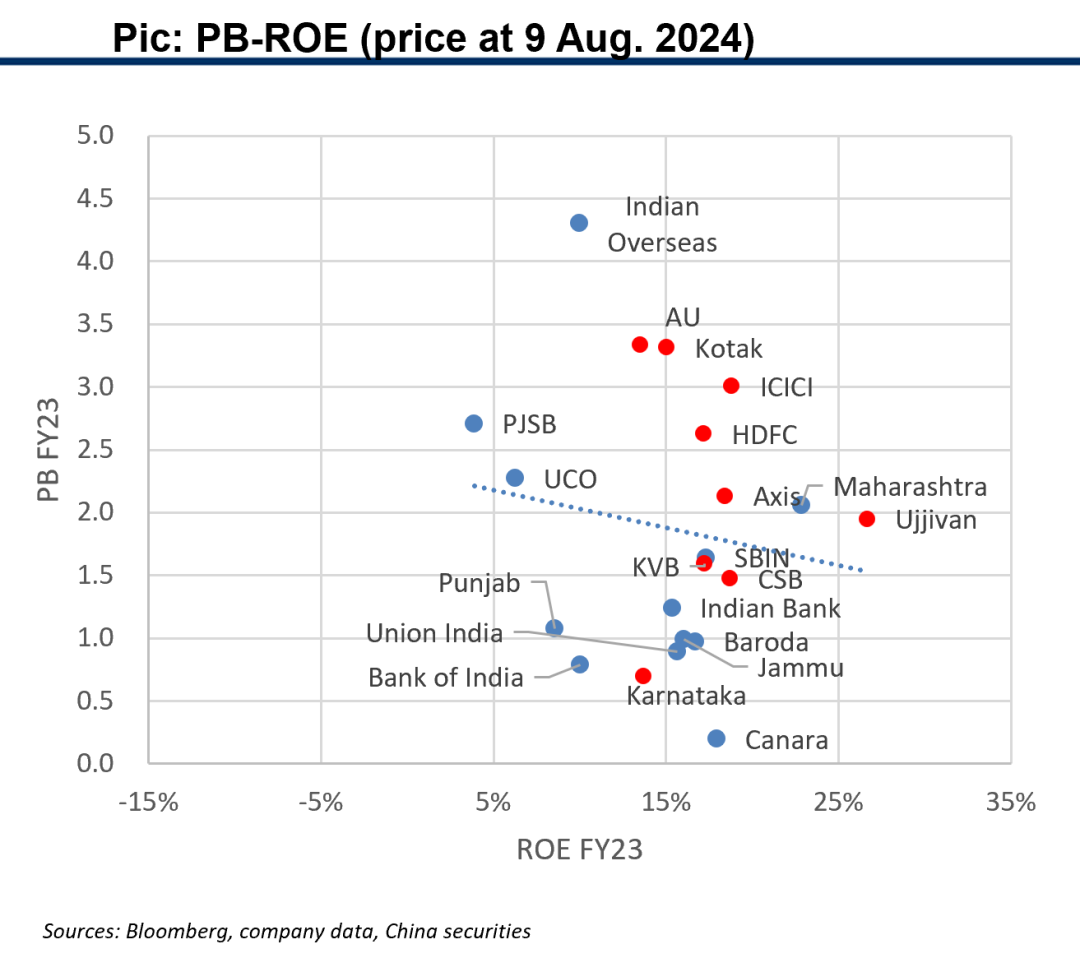
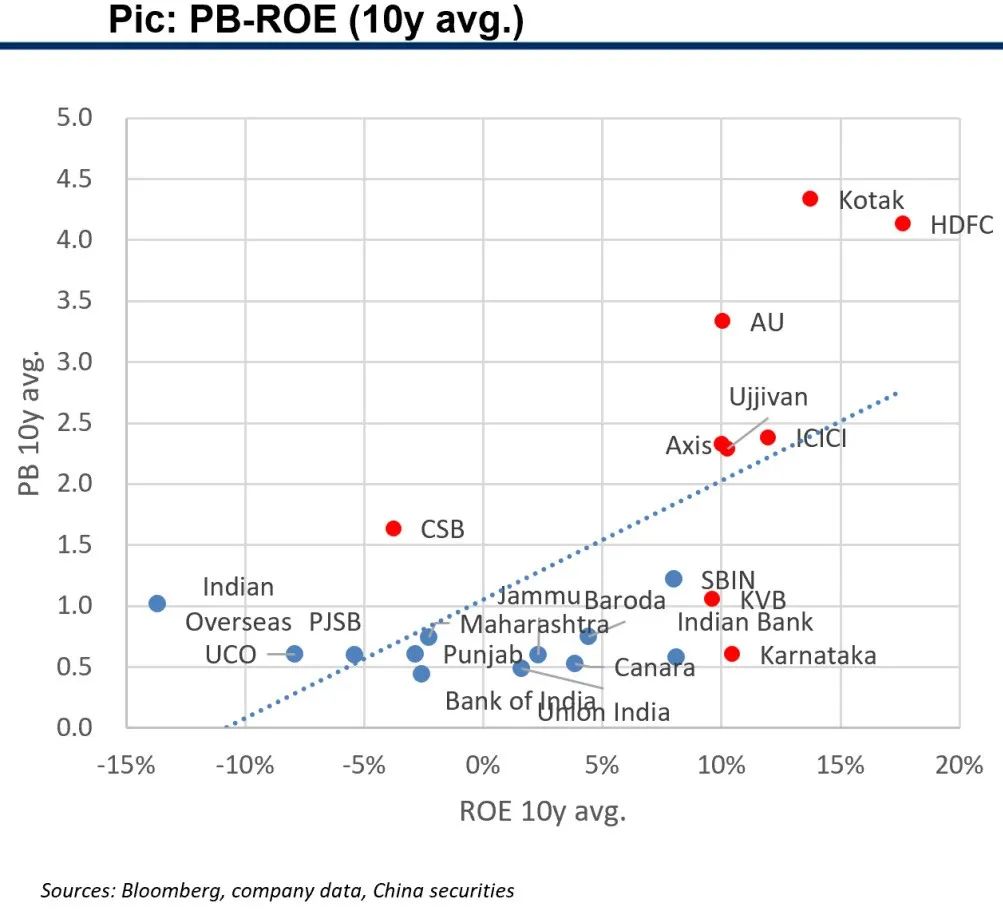
2.1 India: key comp metrics: PB-ROE
Private banks kept their advantages in ROEs during past 10 years, some of them further enhanced their ROEs. But SOBs increased their ROEs moreover, thus bigger gains in valuation from the low levels 10 years ago.
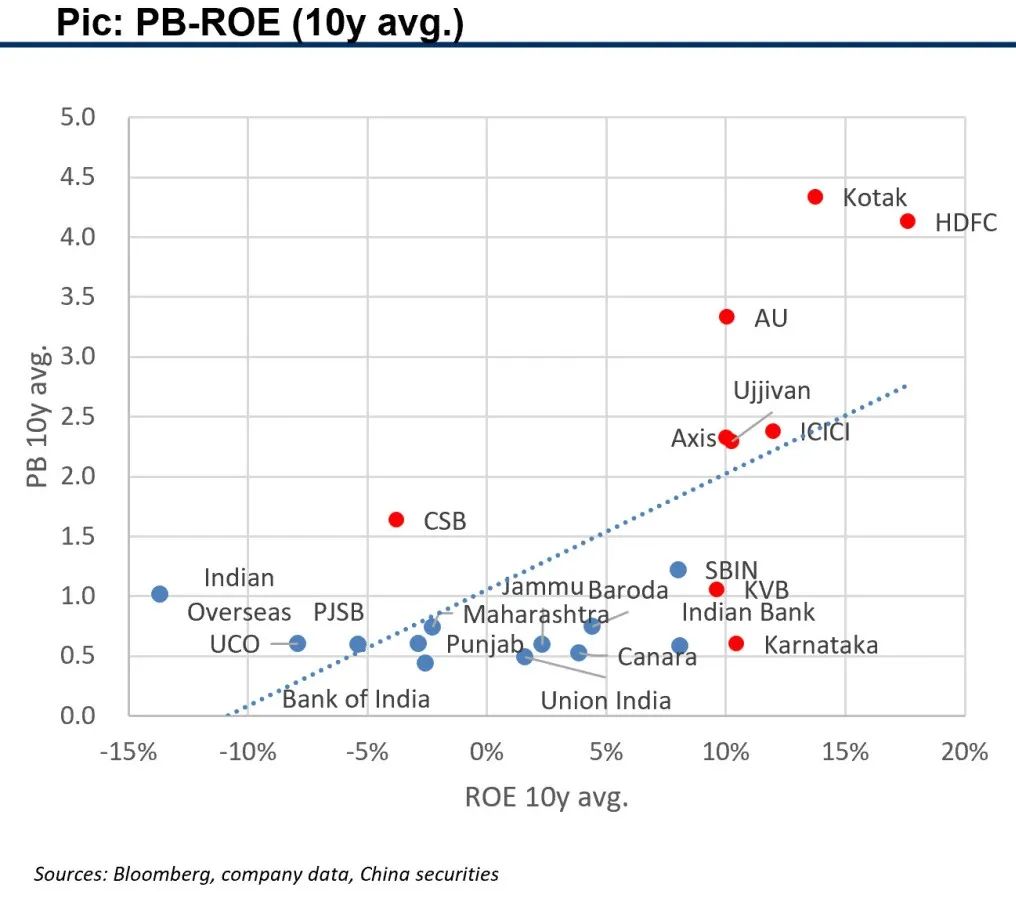
2.1 India: key comp metrics: PB-ROE
Valuation catch-up of SOBs has been more remarkable since 2024, which even made the average PB-ROE relationships tilted reversely.
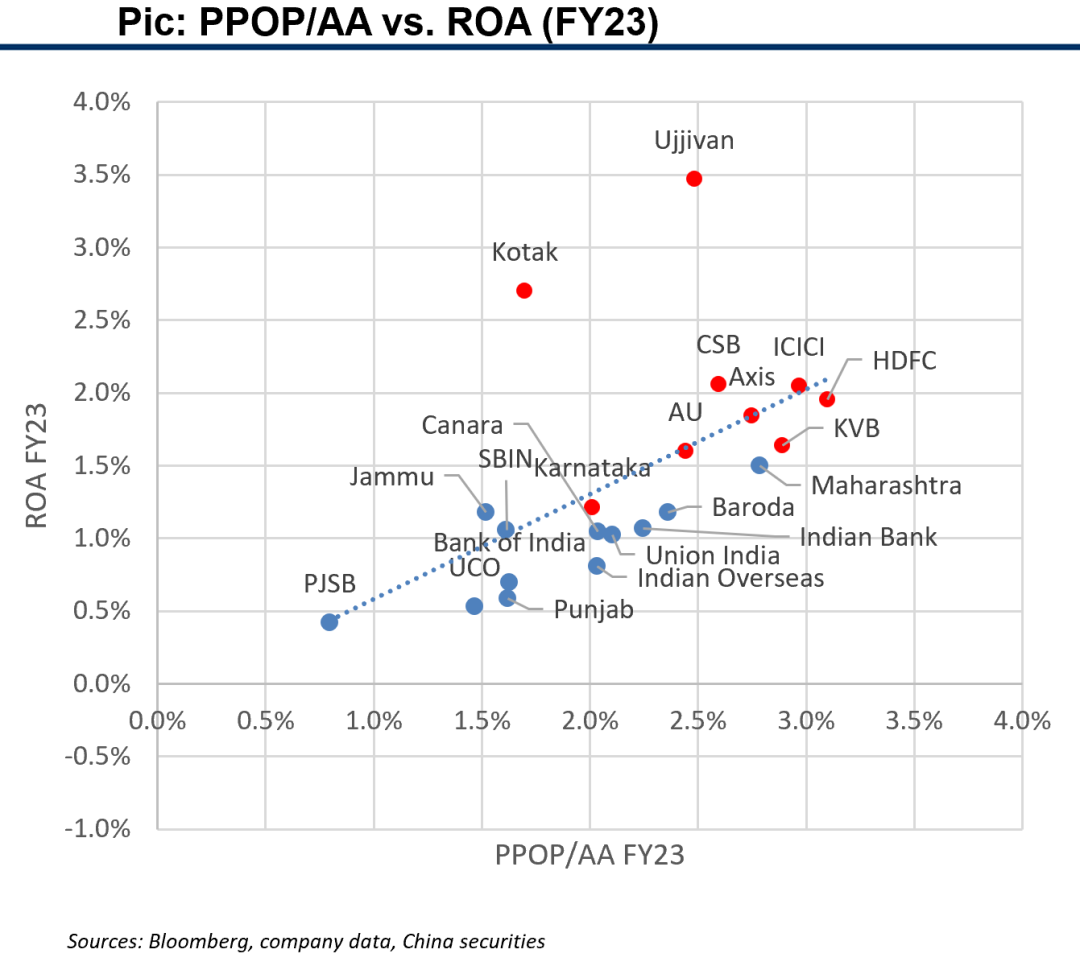
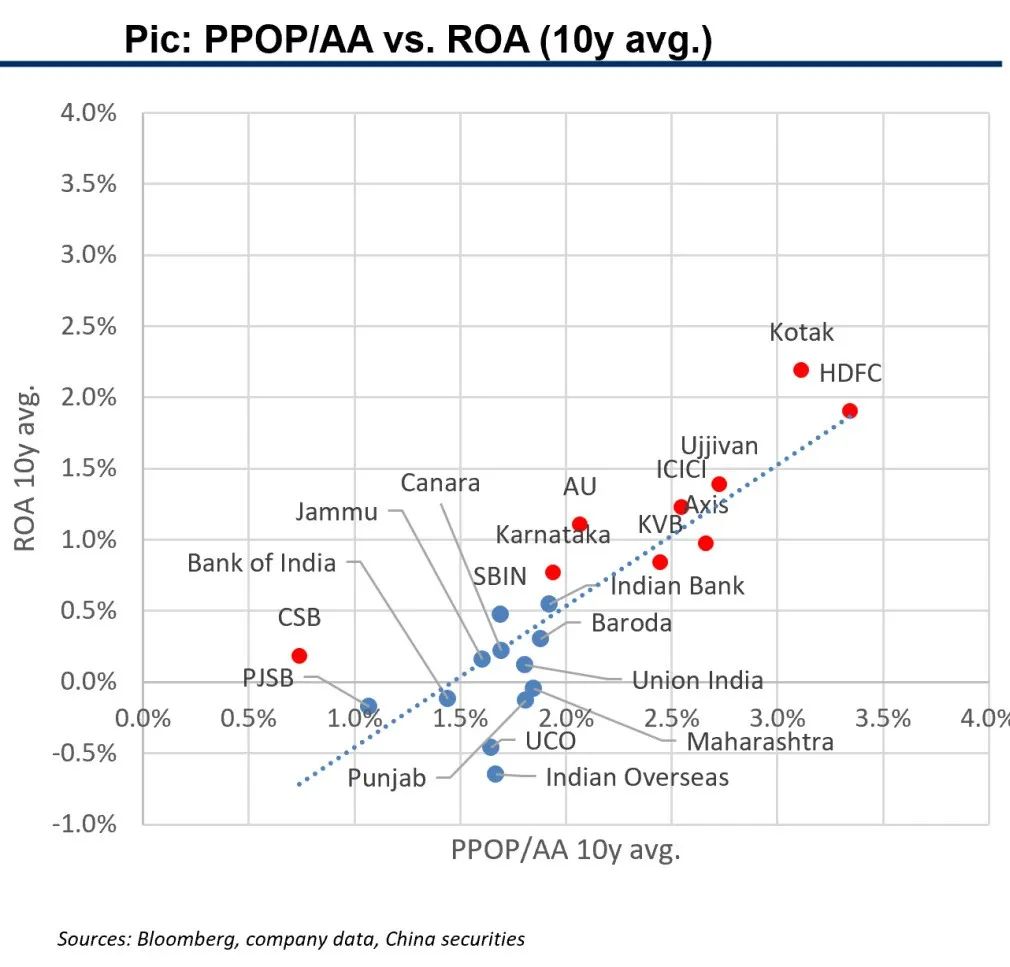
2.1 India: key comp metrics: growth
India banks’ core growth power enhanced apparently in past 10 years.
Private banks are still in clear leading position on growth, but the gap has been greatly diminished in 10 years time.
2.1 India: key comp metrics: revenue quality
Pic: NIM comps: generally exceeding LT trends in FY23
Pic: Private banks have clear advantages in fee business, SOBs rely more on trading-related non-NII
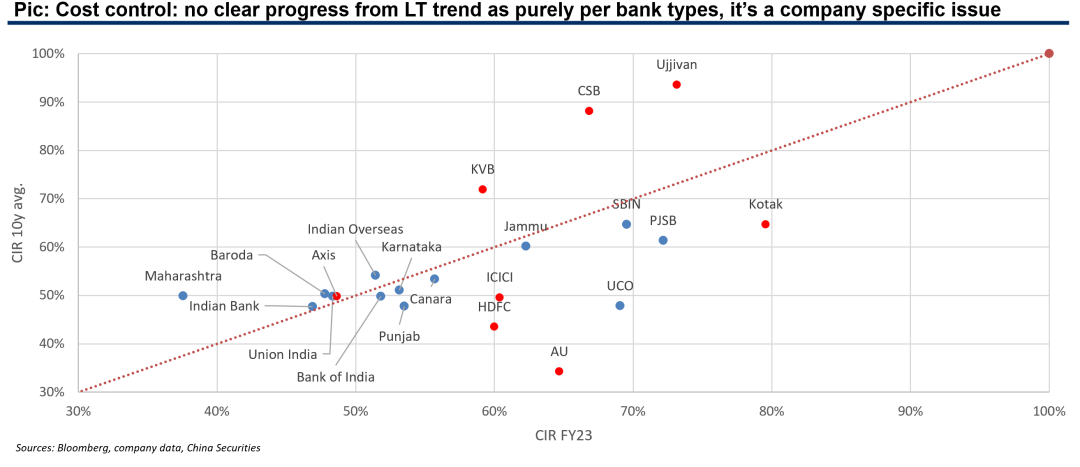
2.1 India: key comp metrics: operational efficiency
Pic: Cost control: no clear progress from LT trend as purely per bank types, it’s a company specific issue
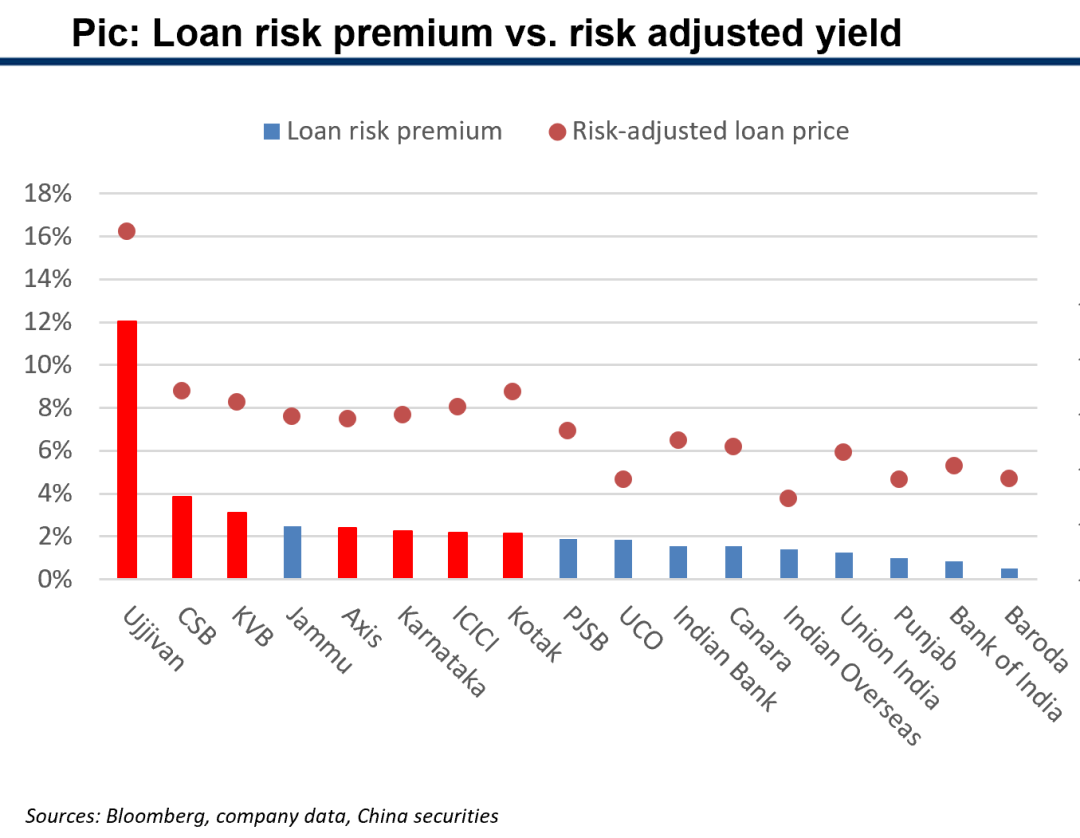
2.1 Loan pricing and deposit cost
In a10-year view, India banks’ loan risk premiums are generally in line withrisk-adjusted yield, but with some exceptions which have higher risk premiumsbut lower final risk-adjusted yields, mostly among SOBs.
Realdeposit cost is correlated with the bank’s CASA ratio, there are some SOBs withsector-leading deposit cost out of not-so-high CASA ratios.
Privatebanks weaker on deposit tend to be more aggressive on loan pricing, this doesnot happen among SOBs.
2.1 Asset quality comps
Private banks generally have lower NPL formation and provision coverages are similar.
NPL formations are not 100% positively related to NIM levels. Names with low NPL formations, high loan risk premiums (on the previous page) are strong banks.
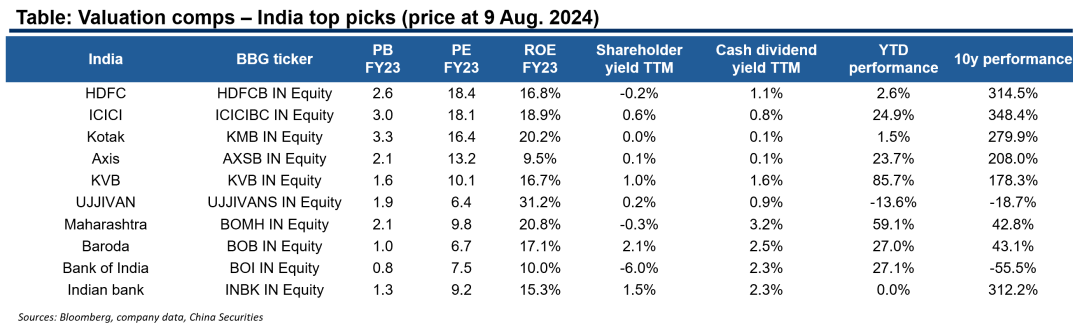
2.1 Top picks: India
We list the following banks as top picks in India, with the first five key representatives of private banks in India.
UJJIVAN is here because of its outstanding micro lending business.
The final four SOBs are listed due to their clear improvement on operating metrics as well as still reasonable valuations against the backdrop of general re-rating of SOBs in India.
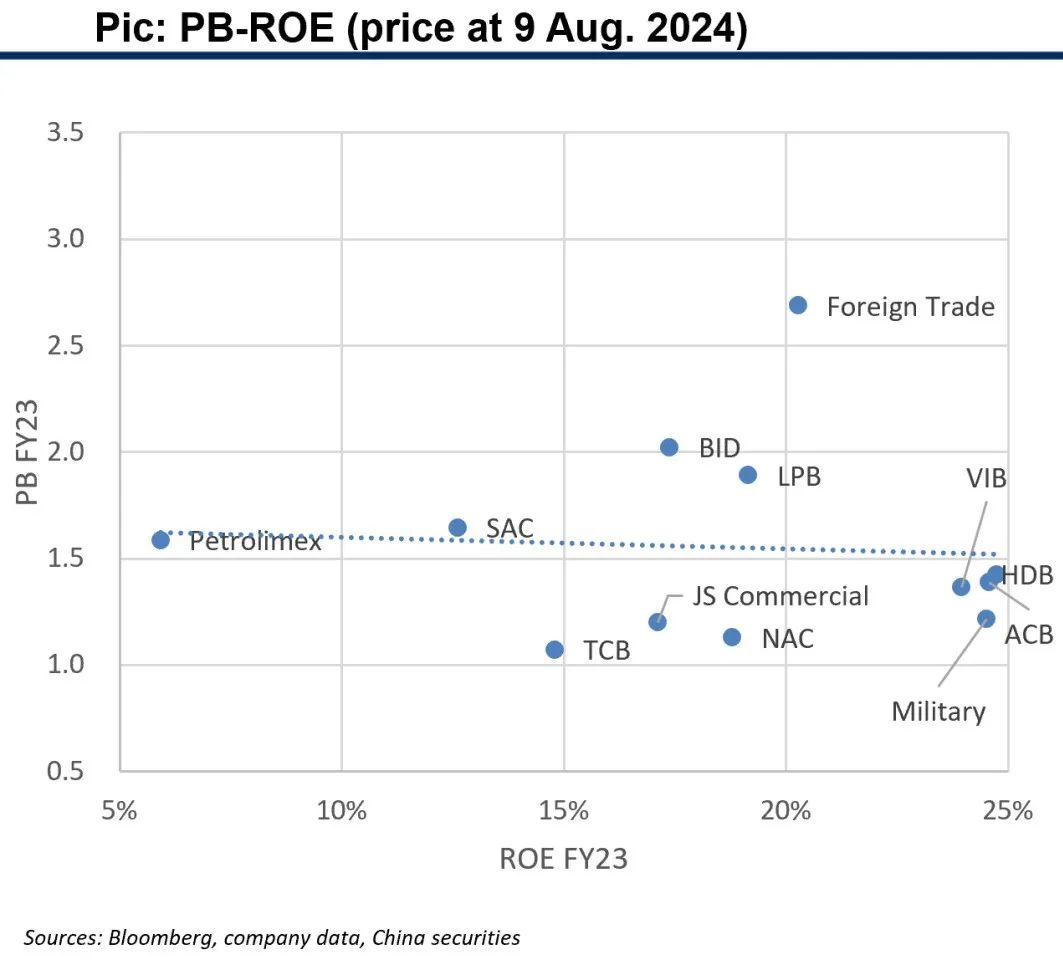
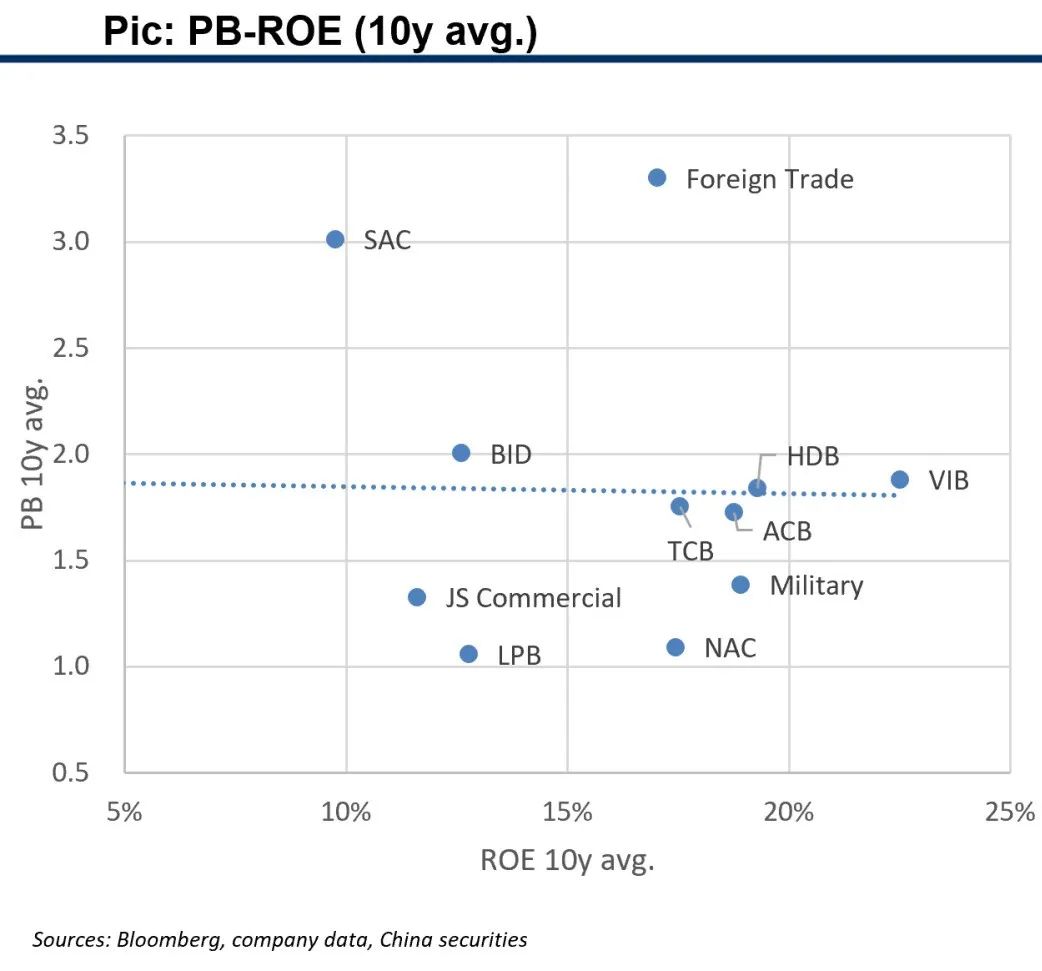
2.2 Vietnam: key comp metrics: PB-ROE
Vietnam banks’ ROEs increased remarkably in past 10 years, but valuations do not follow suit.
Average PB-ROE relationships do not follow positive correlations, the situation that high ROE banks valued low is common in Vietnam, both in ST and LT.
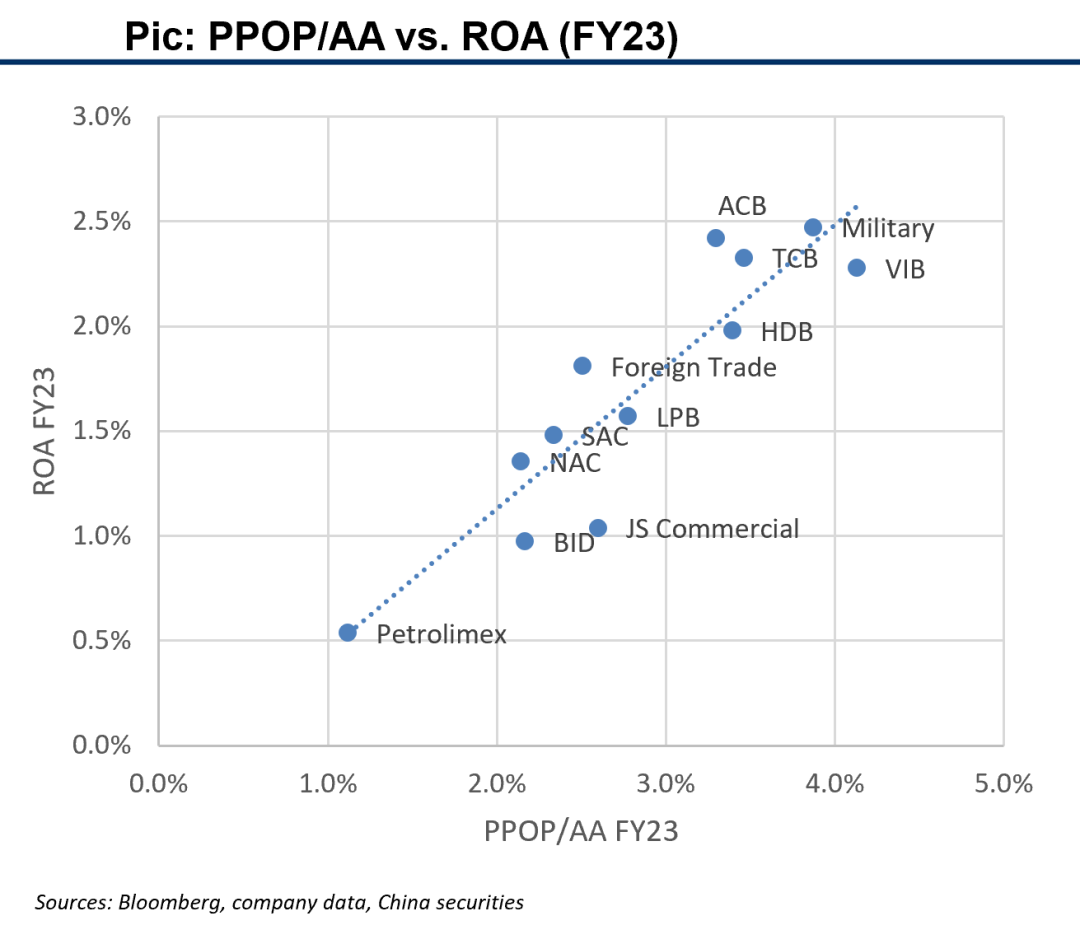
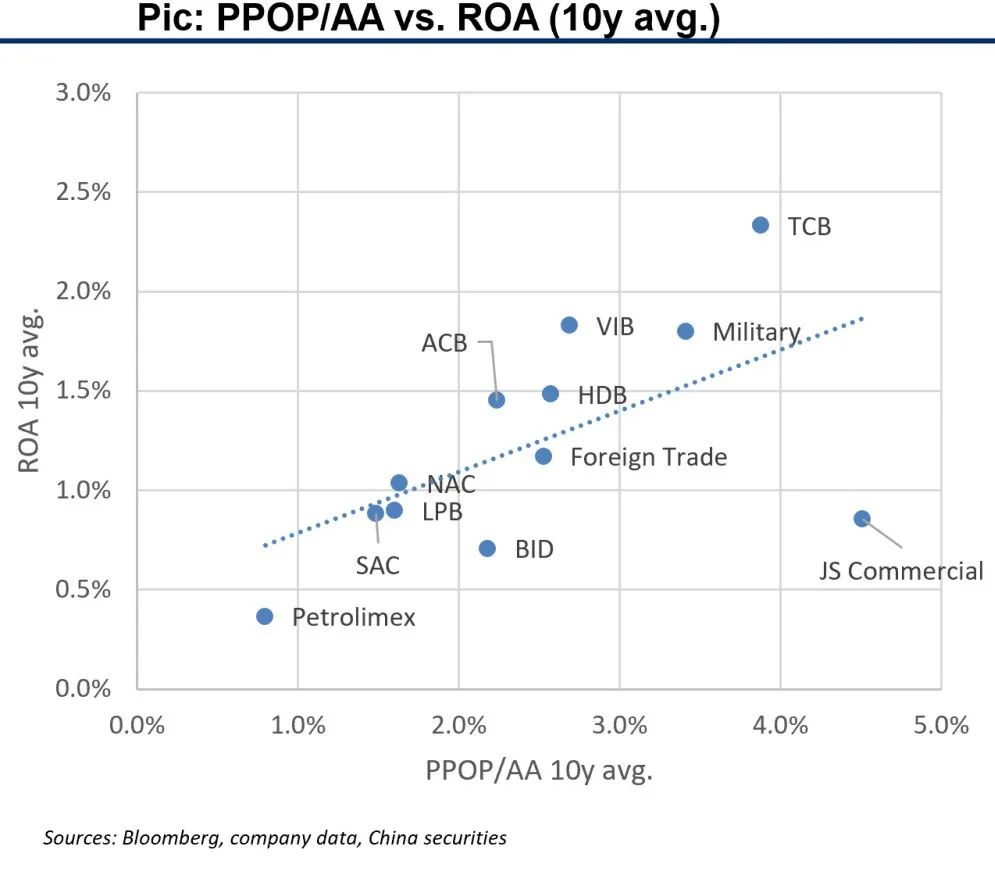
2.2 Vietnam: key comp metrics: growth
The majority of selected Vietnam banks moved into good-growth group of PPOP/AA>2%, several moved into high-growth group of PPOP/AA>3%.
ROA increasing paces are even slightly faster than PPOP/AA.
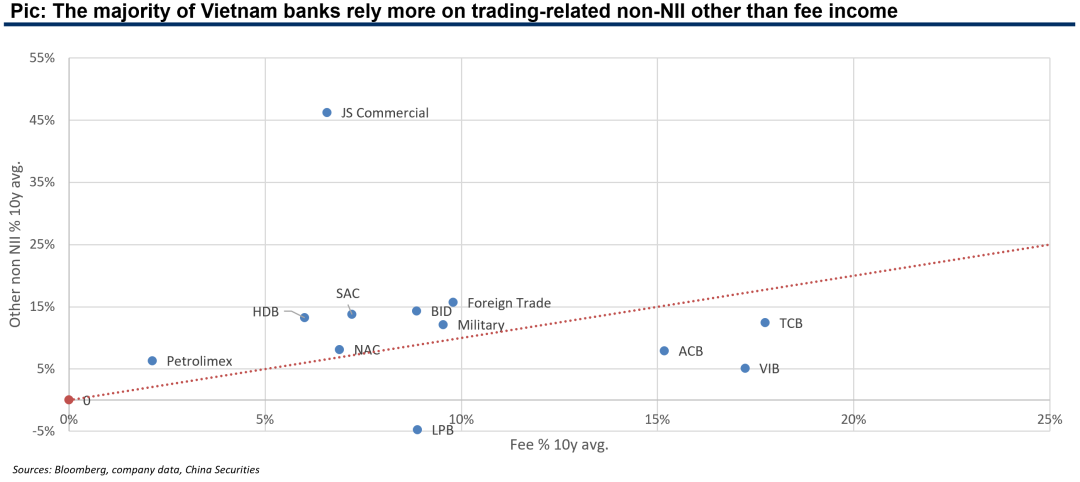
2.2 Vietnam: key comp metrics: revenue quality
Pic: NIM comps: the majority of banks exceeding LT trends in FY23
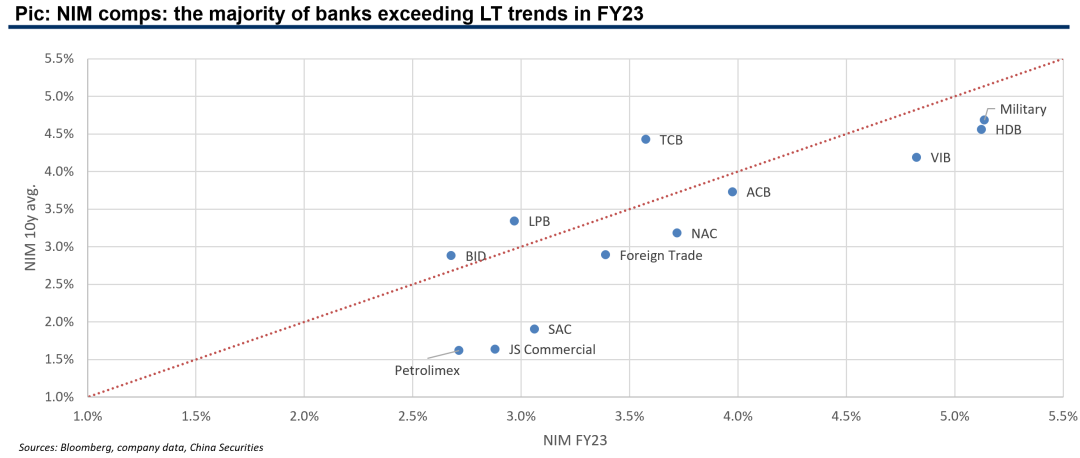
Pic: The majority of Vietnam banks rely more on trading-related non-NII other than fee income
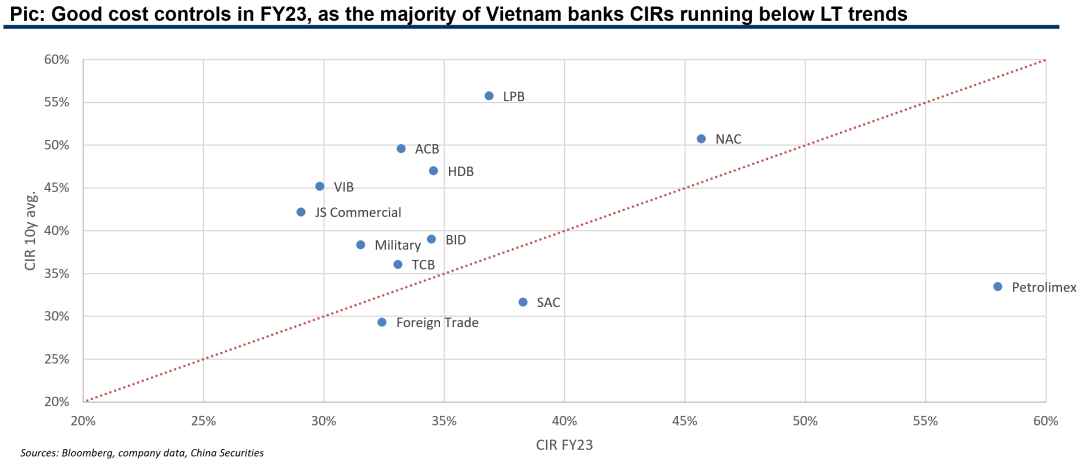
2.2 Vietnam: key comp metrics: operational efficiency
Pic: Good cost controls in FY23, as the majority of Vietnam banks CIRs running below LT trends
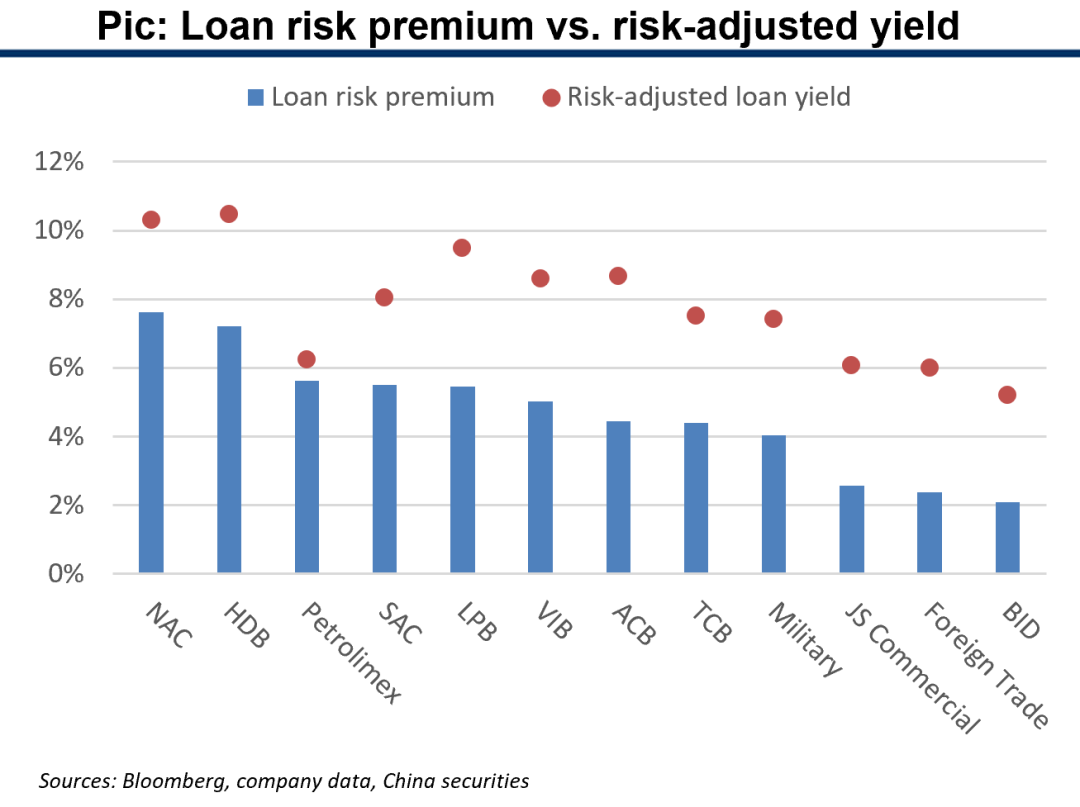
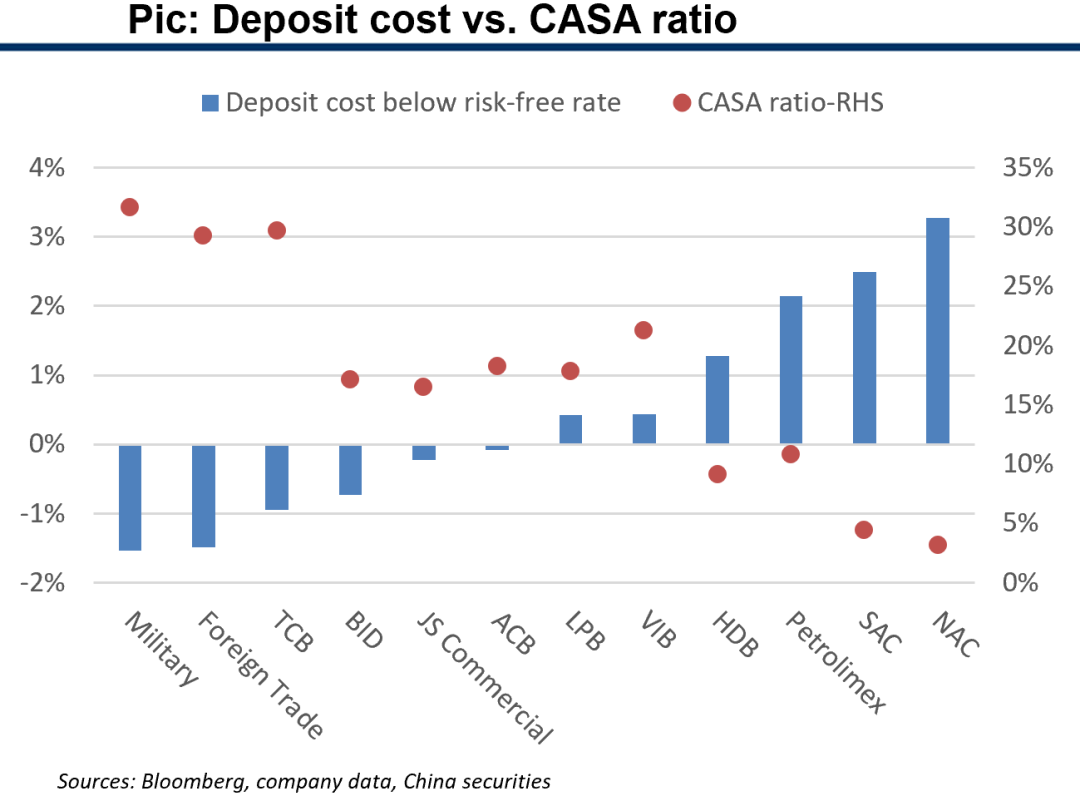
2.2 Loan pricing and deposit cost
Loan risk premiums and risk-adjusted yields are generally in line, the obvious exception Petrolimex with higher premium and lower adjusted yield has low provision coverage.
Deposit costs are also closely correlated with CASA ratios, for most cases.
Some banks clearly have low yields on both A/L and low risk style, like Foreign Trade, TCB, Military. While some are high yields on both A/L but also relatively low risk style, like NAC.
Some banks have strong pricing power with medium premiums and low NPL formations, like ACB.
2.2 Asset quality comps
10y avg. gross NPL formations of Vietnam banks are all below 50bps, which are impressive. Formations are not exactly positively correlated with NIM levels. Enough is enough provision strategy, with most banks under 200%.
Banks with high NIMs and low NPL formations: ACB, TCB.
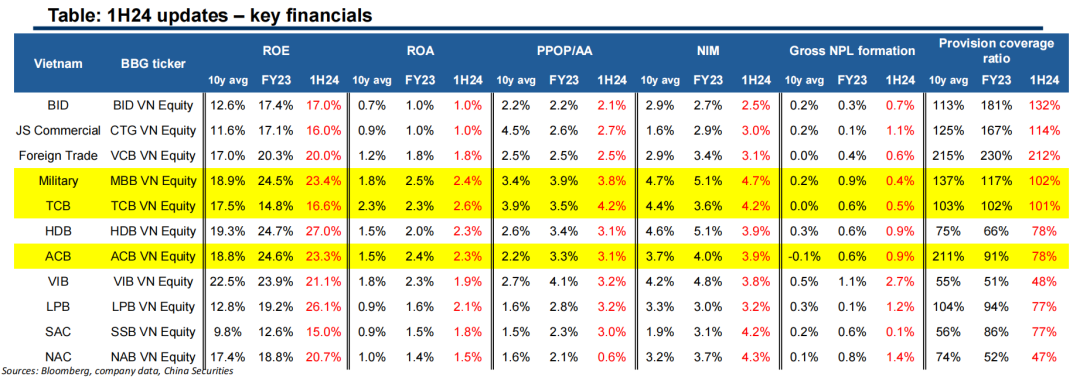
2.2 1H24 updates: key financials
Core earning metrics of ROE, ROA and PPOP/AA generally maintained momentum in 1H24.
NIM softened from FY23 levels for some banks.
Gross NPL formation increased from FY23 levels and provision coverage declined, for most banks.
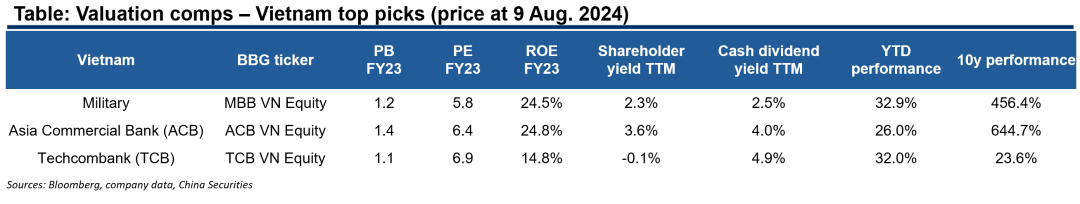
2.2 Top picks: Vietnam
We list three top picks in Vietnam because of their clear leadership in ROE/ROA, a good combination of lending pricing power and risk control, and reasonable valuations.
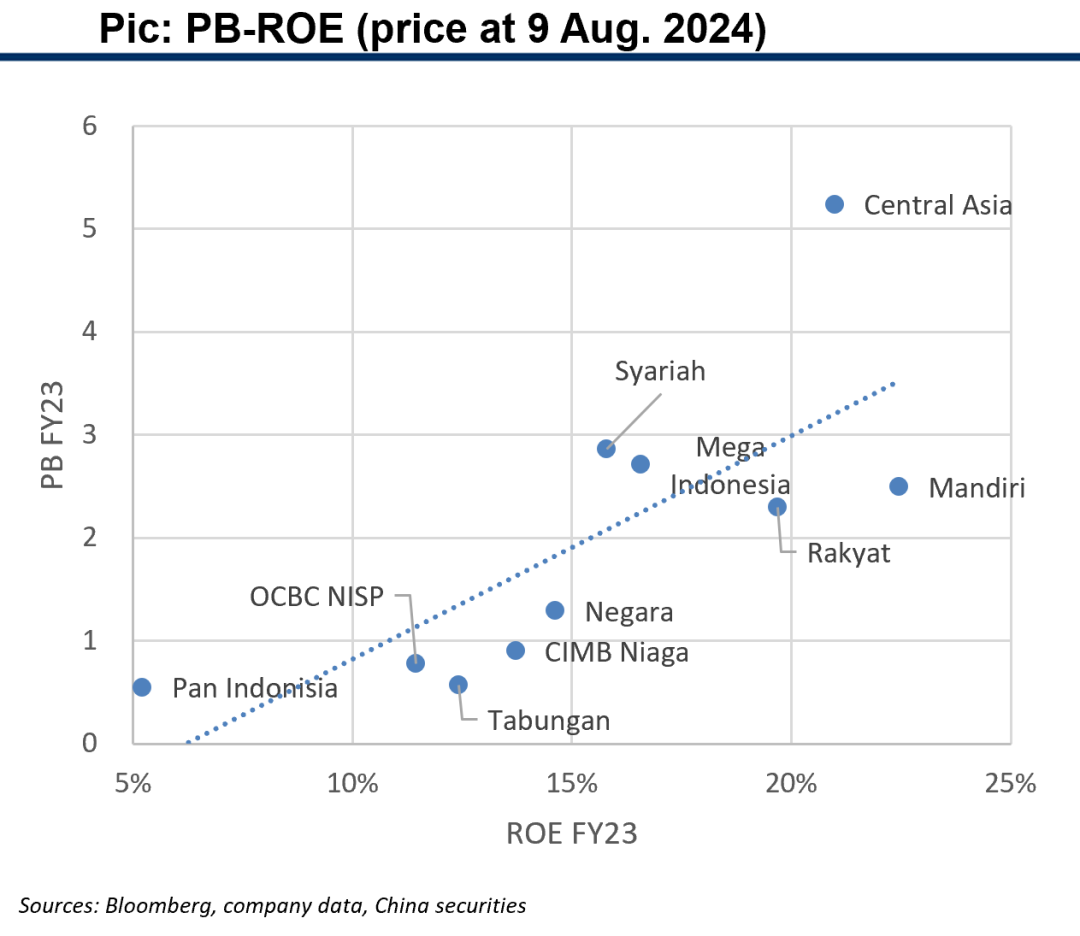
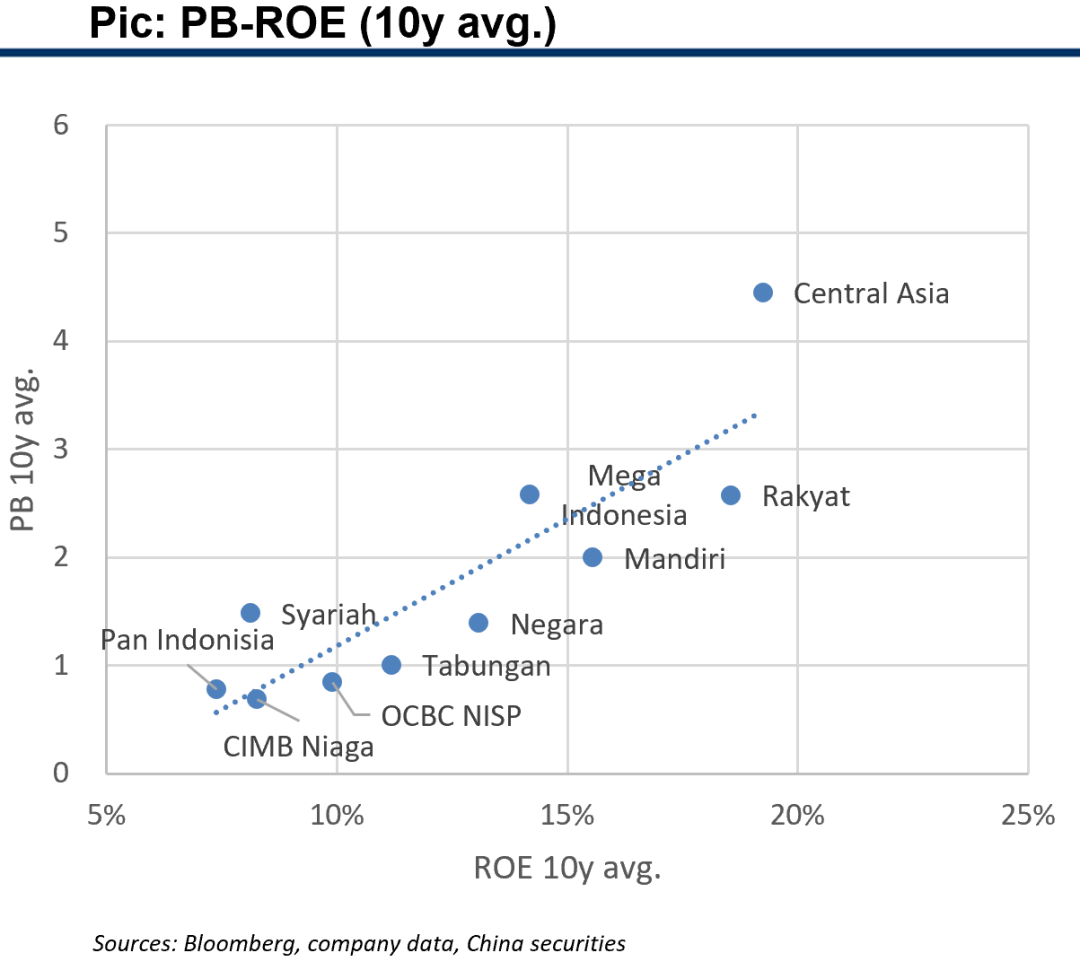
2.3 Indonesia: key comp metrics: PB-ROE
Indonesia banks enjoy high ROEs in past 10 years, which further improved in FY23, for majority of them.
But valuations do not increase furthermore, which are generally kept around their LT levels, 2-3x PB for the best banks and 1-2x PB for the average ones. We should notice that current valuations are high when compared globally.
Pricing is highly effective in the Indonesian banking sector with clear positive PB-ROE correlations.
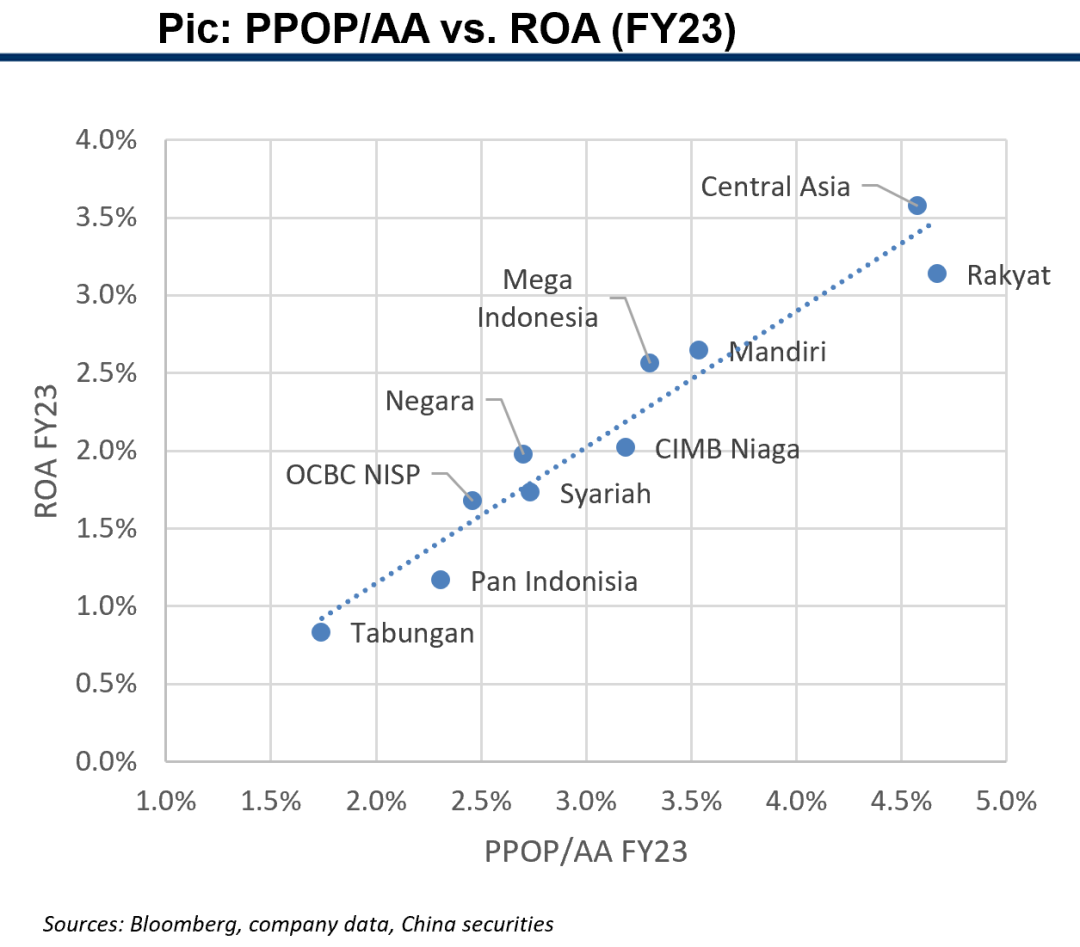
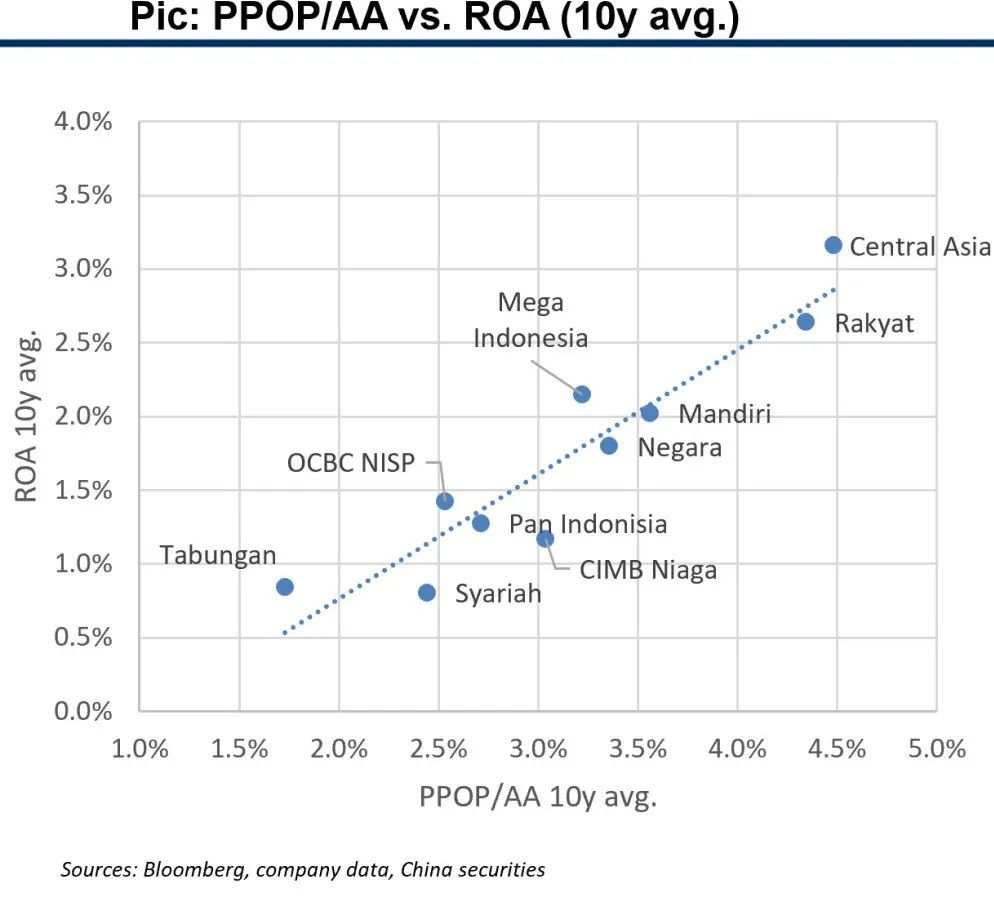
2.3 Indonesia: key comp metrics: growth
Best Indonesia banks have maintained PPOP/AA>3% in past 10 years, the majority of Indonesia banks are good-growth banks with PPOP/AA>2%. Good-growth banks generally increased core growth power in FY23.
ROAs generally go up alongside PPOP/AA, showing good underlying asset qualities when lifting revenues.
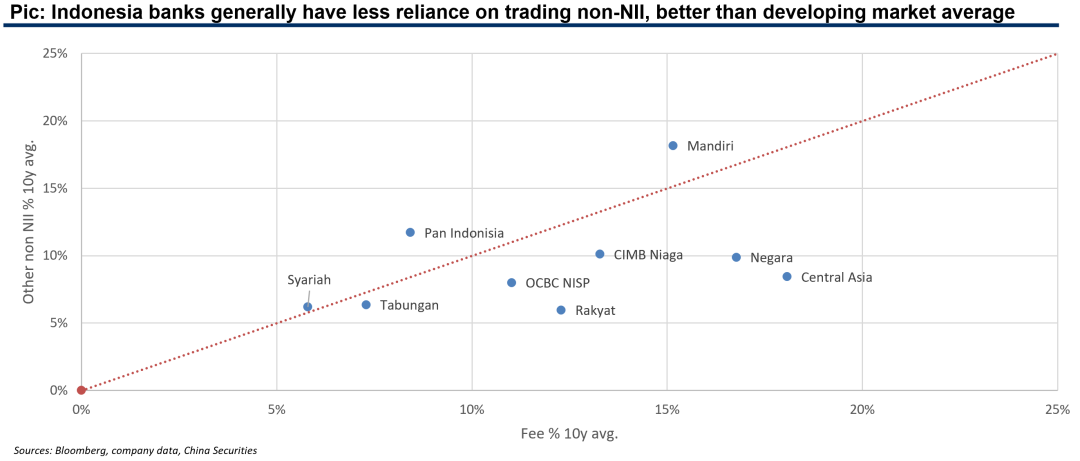
2.3 Indonesia: key comp metrics: revenue quality
Pic: NIM comps: the majority of NIMs in FY23 lagging behind LT trends, showing further potentials ahead
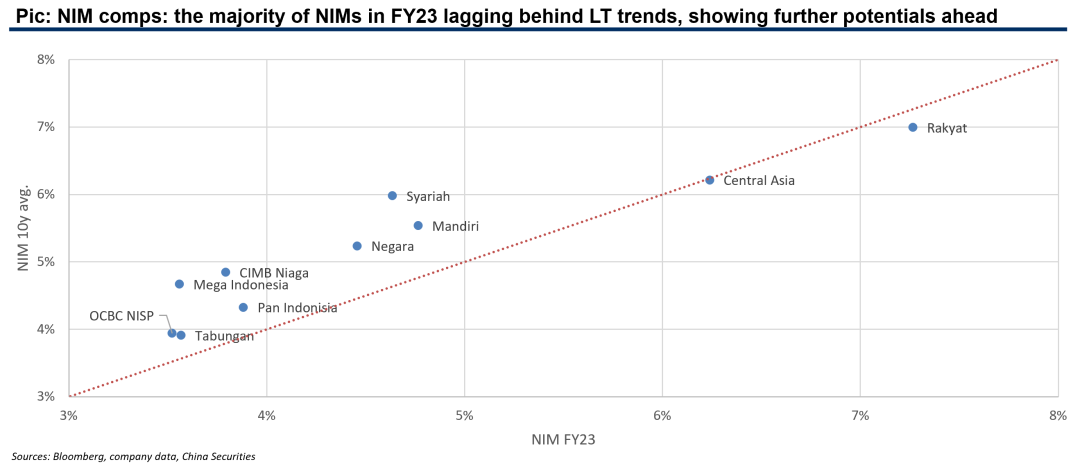
Pic: Indonesia banks generally have less reliance on trading non-NII, better than developing market average
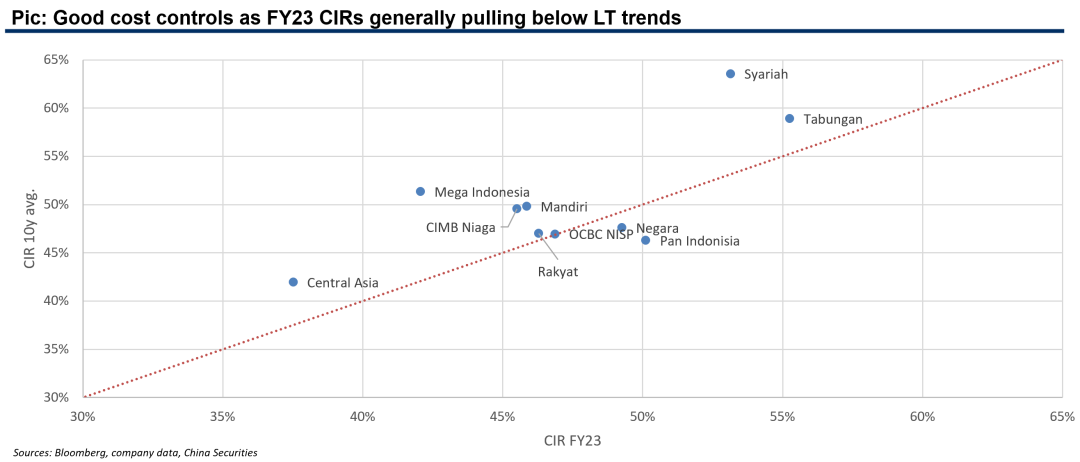
2.3 Indonesia: key comp metrics: operational efficiency
Pic: Good cost controls as FY23 CIRs generally pulling below LT trends
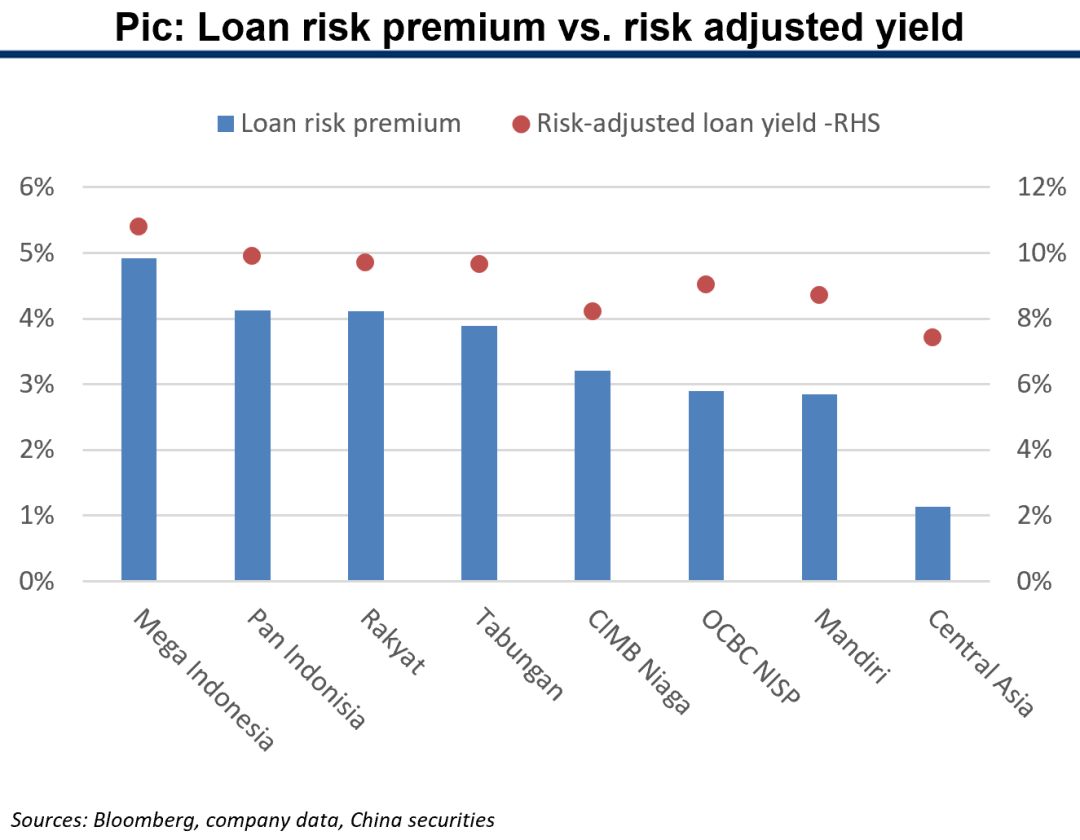
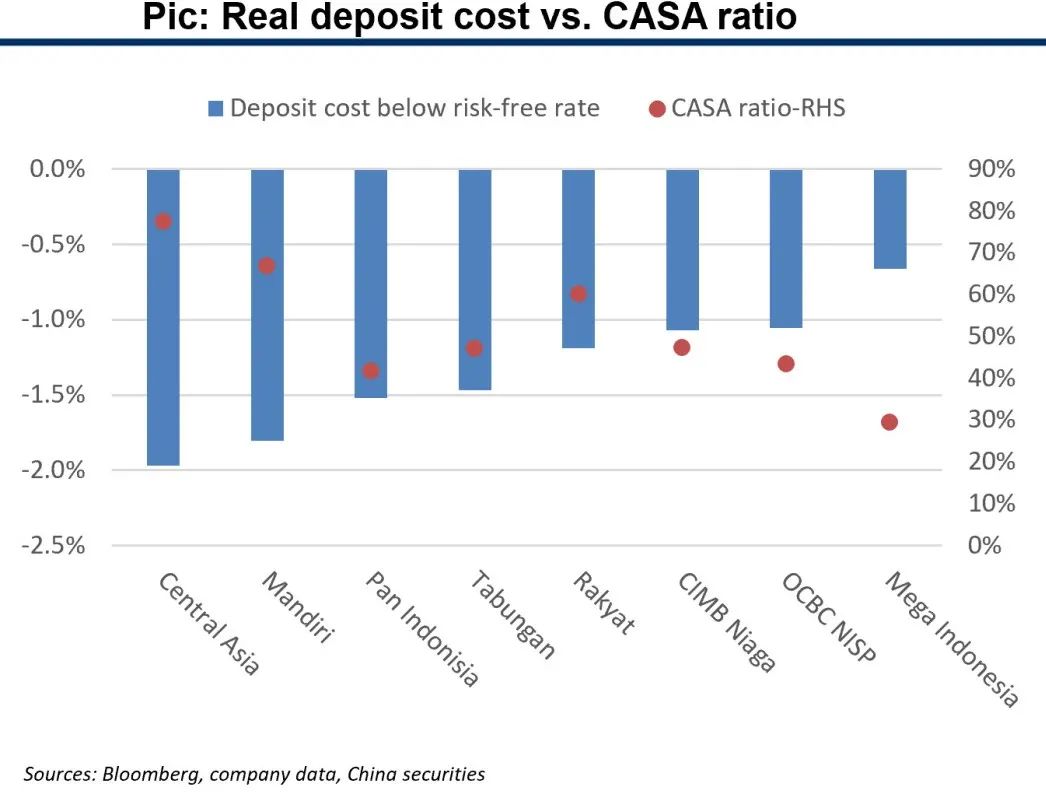
2.3 Loan pricing and deposit cost
Central Asia and Mandiri are low yield and low cost style, but Central Asia NPL formations is better than Mandiri.
OCBC NISP is also conservative on both asset pricing and NPL formation, but its funding cost is relatively weak.
Mega Indonesia’s highest lending risk premium seems not enough to cushion its weakest funding base, its highest risk-adjusted yield might be a result of low credit cost with the lowest provision coverage.
2.3 Asset quality comps
Gross NPL formation ratios of Indonesia banks are typical developing market style with the majority ranging from 100-200bps. Provision coverage ratios are generally higher than India and Vietnam banks.
Banks with high NIMs and low NPL formations: Central Asia.
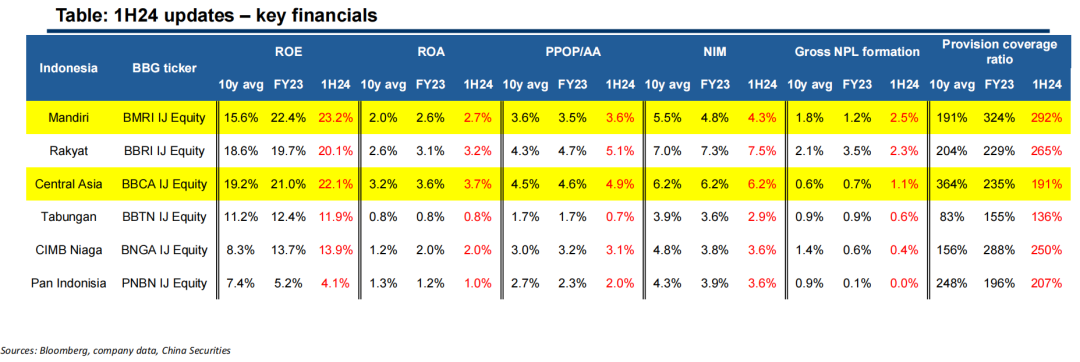
2.3 1H24 updates: key financials
Core earning metrics of ROE, ROA and PPOP/AA maintained momentum in 1H24.
NIM also kept pace in 1H24 as compared with FY23.
Gross NPL formation showed signs of speeding up in 1H24 and provision coverage declined for most banks.
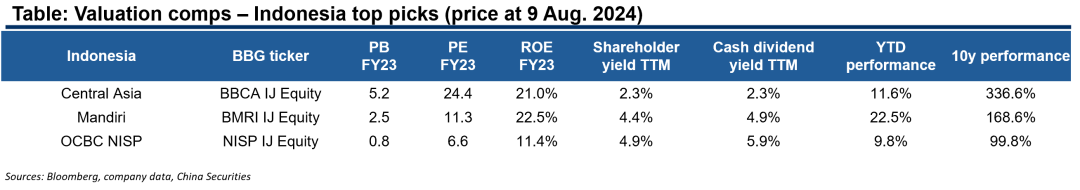
2.3 Top picks: Indonesia
We list three top picks in Indonesia.
We like Central Asia and Mandiri’s strong earning power and good combination of lending pricing and risk control.
We would like to keep a close eye on OCBC NISP’s potential turnaround from the current low valuation to see if its prudent risk control will weigh heavier on future financial trends.
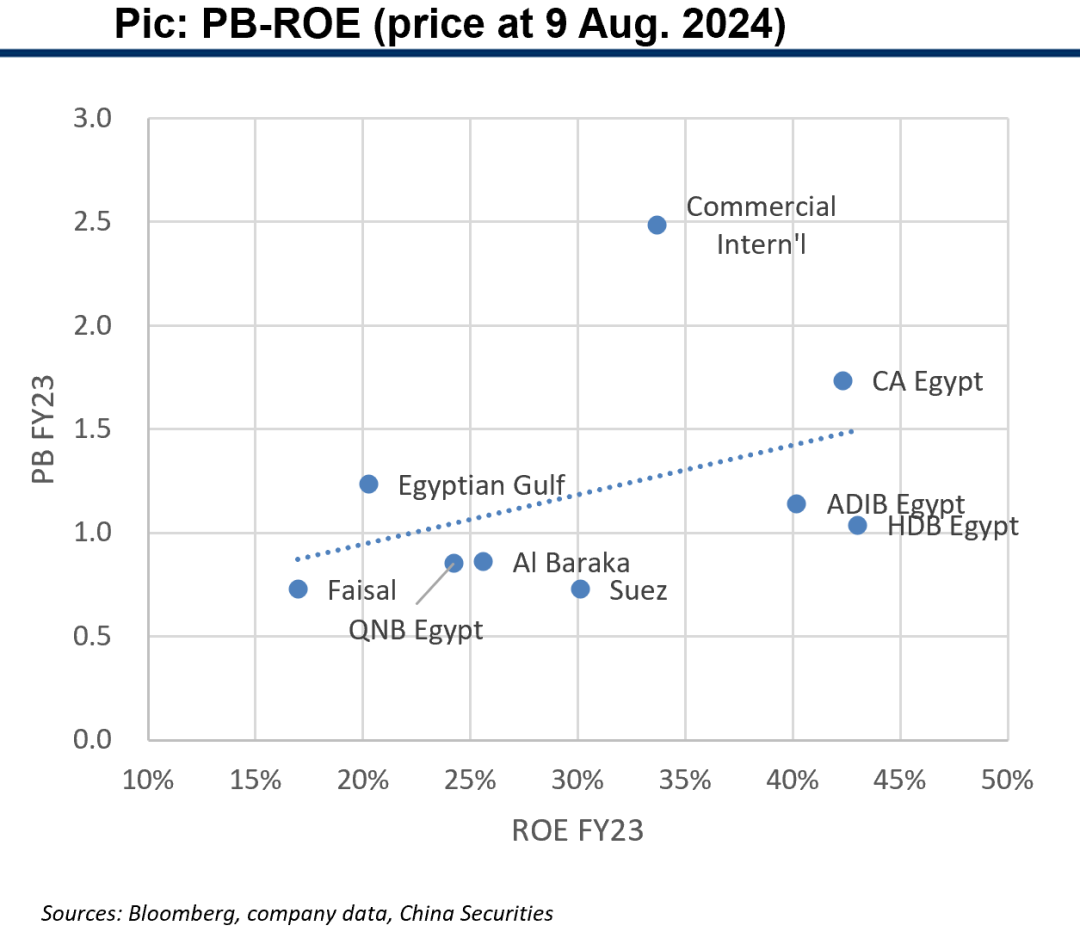
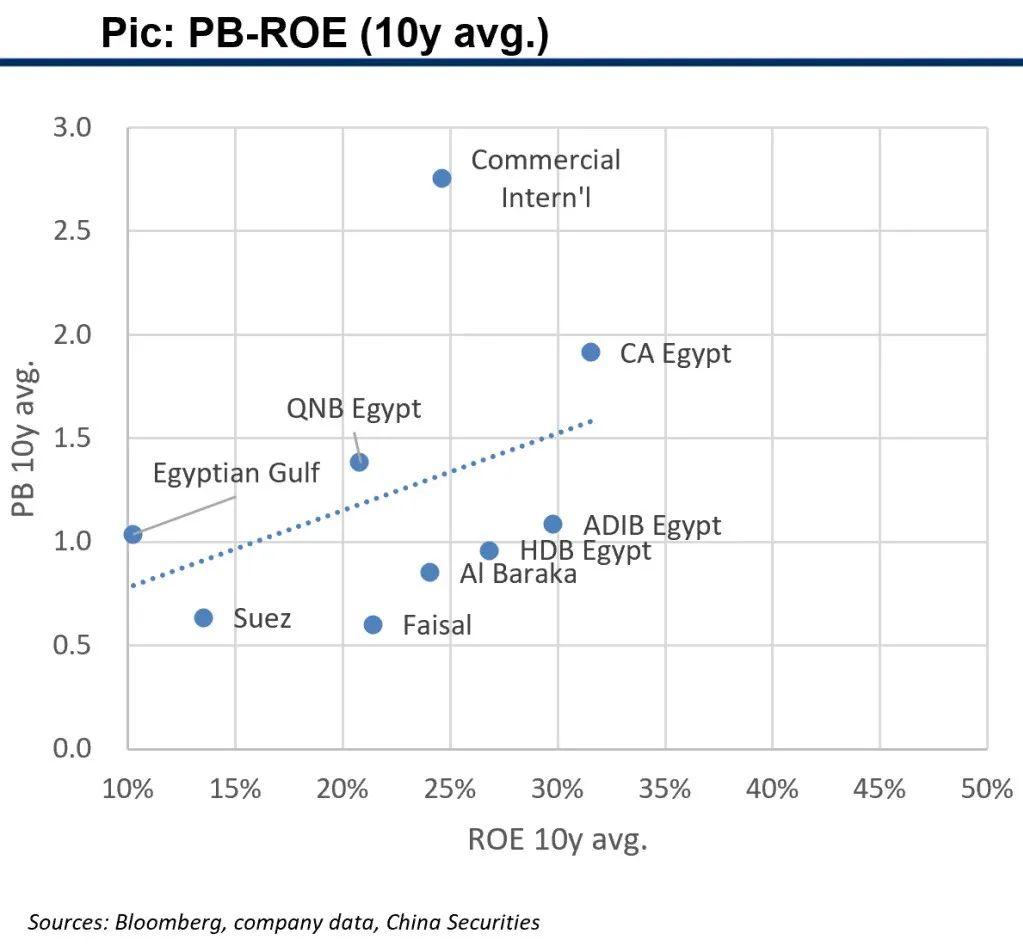
2.4 Egypt: key comp metrics: PB-ROE
Egypt banks enjoyed significant ROE increases in FY23 as compared with 10-year average. But in a sharp comparison, valuation enhancements were quite limited.
Sustainability of such increase is the key of investors’ concerns, after all Egypt has been a high inflation country in recent years and our prior analysis shows the lack of organic ROE growth beyond the inflation-driven expansion.
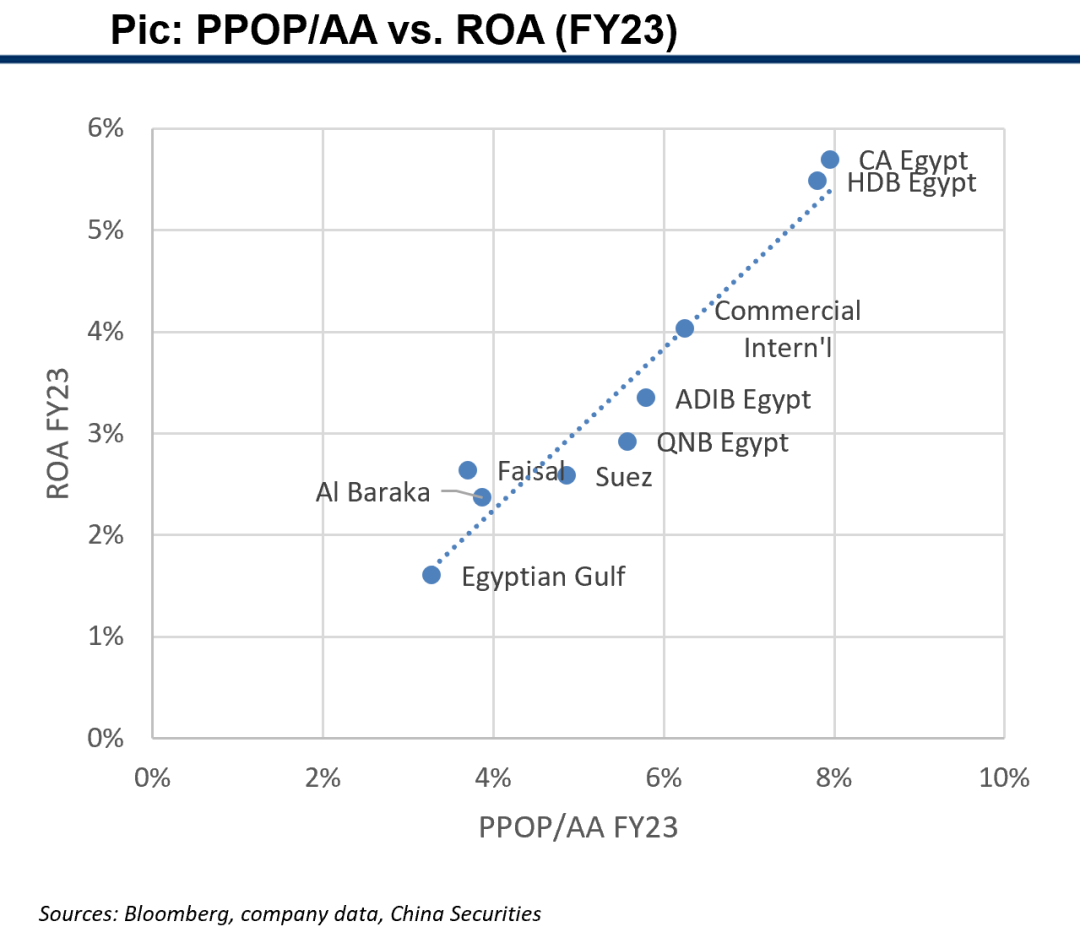
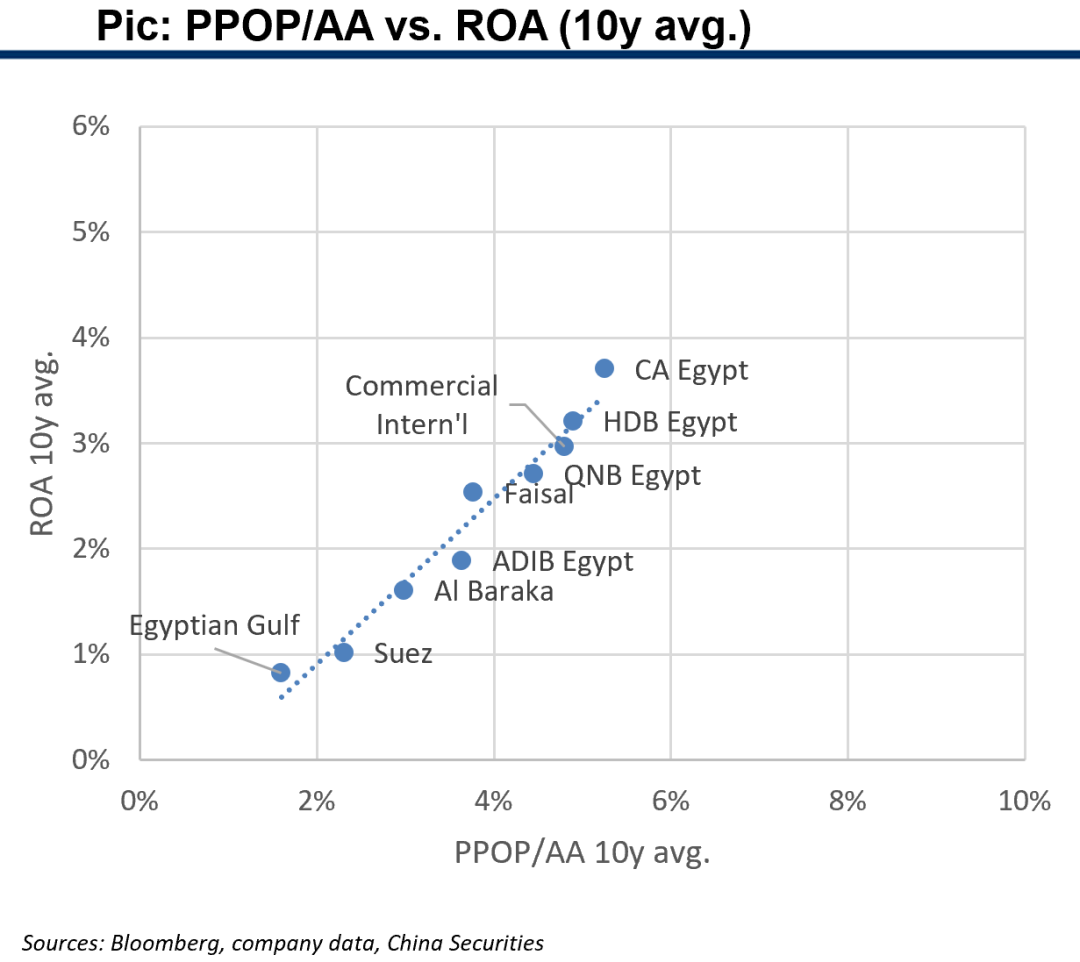
2.4 Egypt: key comp metrics: growth
Both PPOP/AA and ROA of selected Egypt banks also increased remarkably in FY23 when compared with past 10 years.
All selected Egypt banks are high-growth banks with >3% PPOP/AA, which is incredible in global comparison.
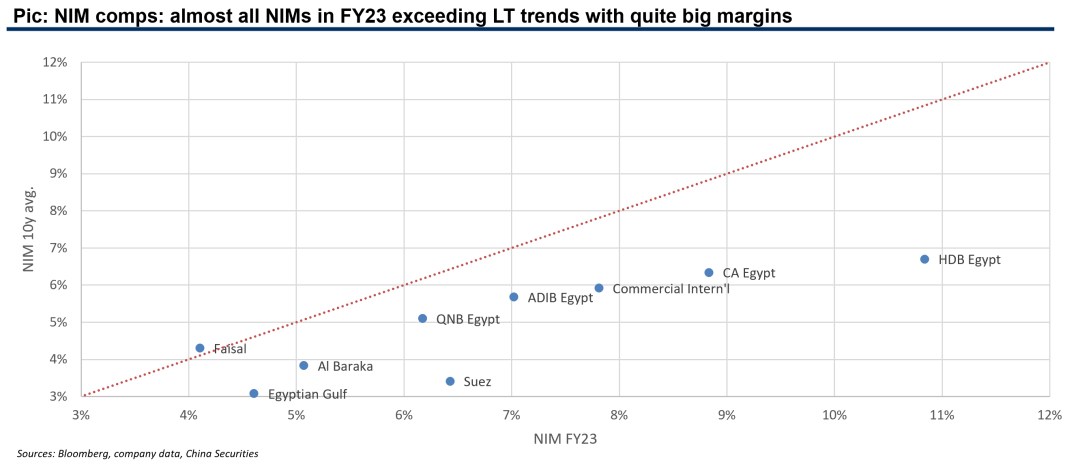
2.4 Egypt: key comp metrics: revenue quality
Pic: NIM comps: almost all NIMs in FY23 exceeding LT trends with quite big margins
Pic: Most Egypt banks do not have high non-NII, but structures are mostly good with higher fee shares

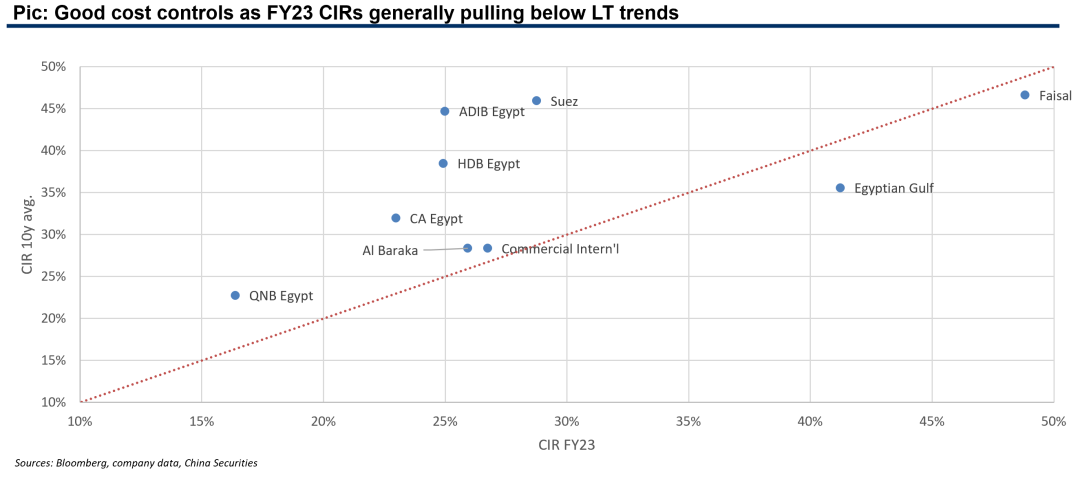
2.4 Egypt: key comp metrics: operational efficiency
Pic: Good cost controls as FY23 CIRs generally pulling below LT trends
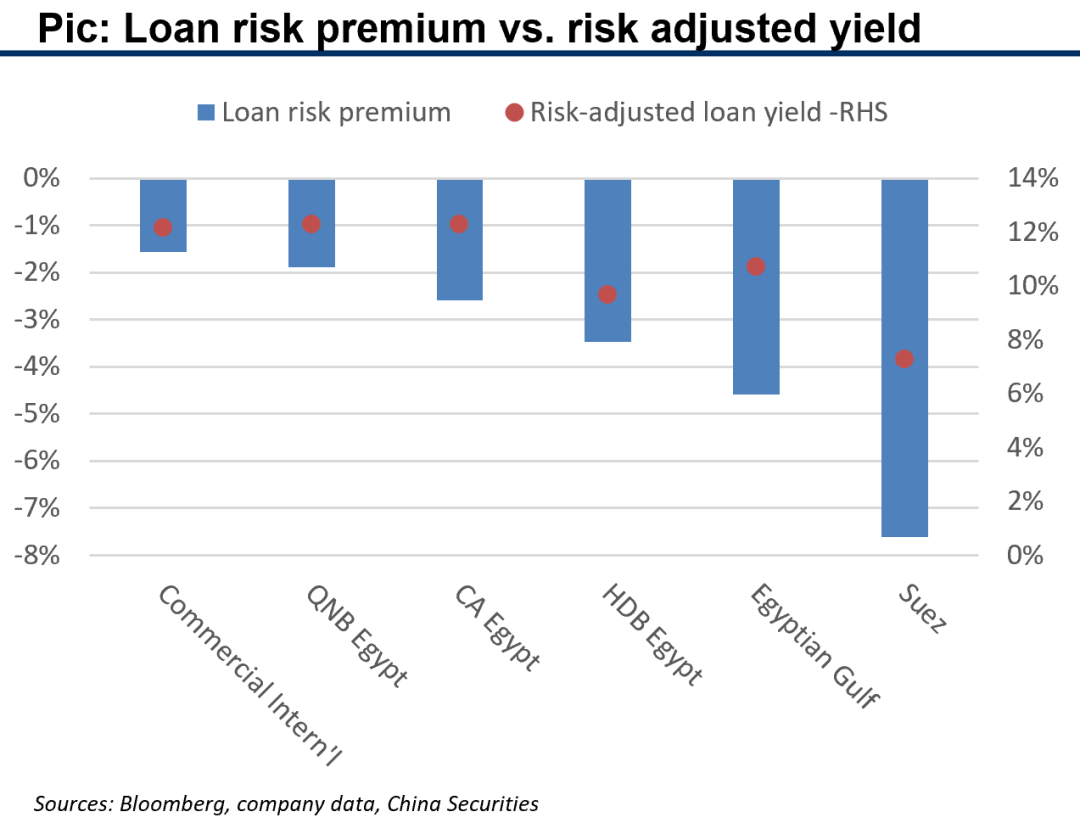
2.4 Loan pricing and deposit cost
Egypt banks are the best demonstration of the harm from consistently high inflation that all banks’ loan risk premiums are negative, even in a 10-year view.
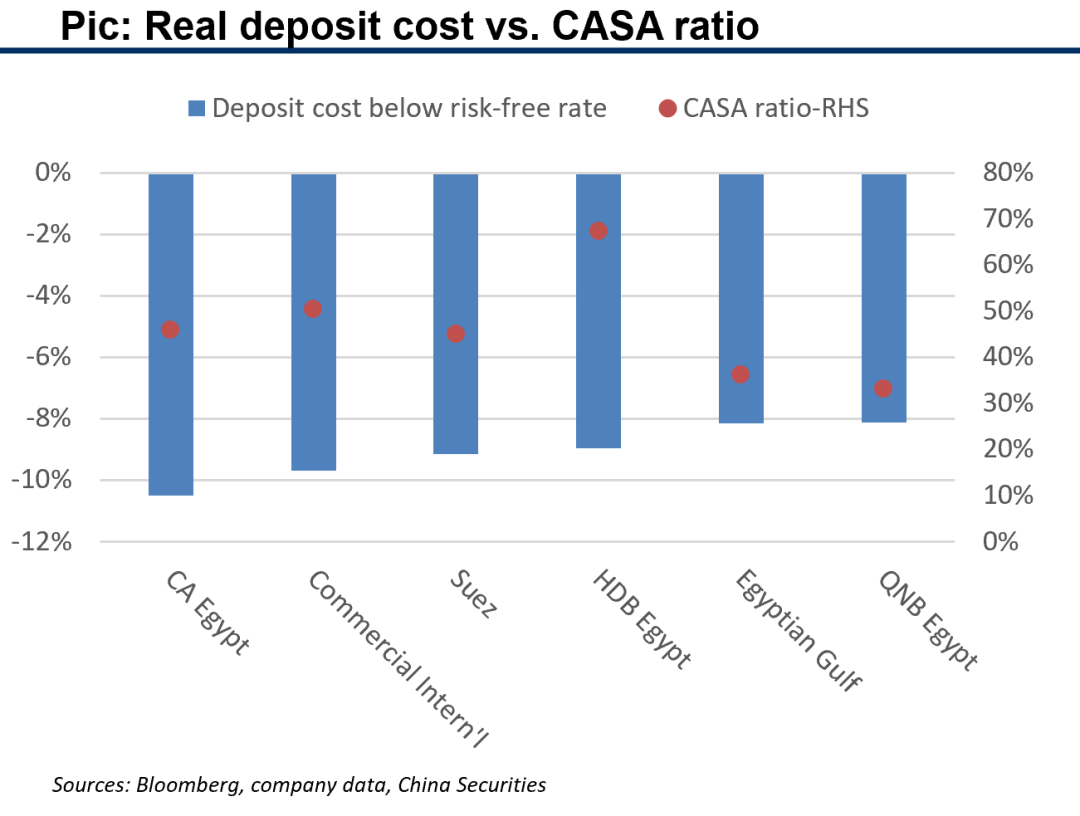
Real deposit costs are deeply negative due to high inflation. Correlations with CASA ratios are not significant, which may become clearer after inflationary pressure settles down.
We would like to wait till the material ease of inflation in the future to make further calls on Egypt banks.
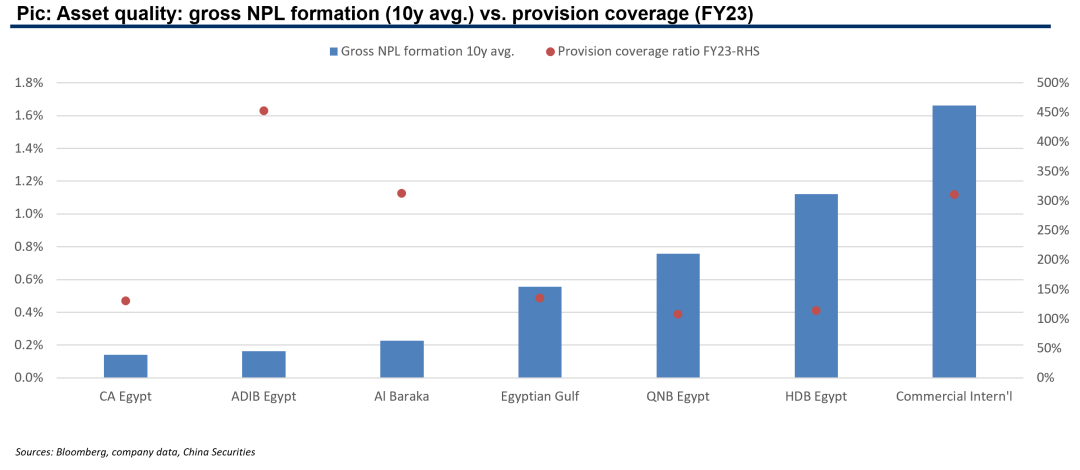
2.4 Asset quality comps
Big differences on both gross NPL formation and provision coverage among Egypt banks. Risk and provisioning strategies across banks are not as unified as Asian banks.
Banks with high NIMs and low NPL formations: CA Egypt, ADIB Egypt.
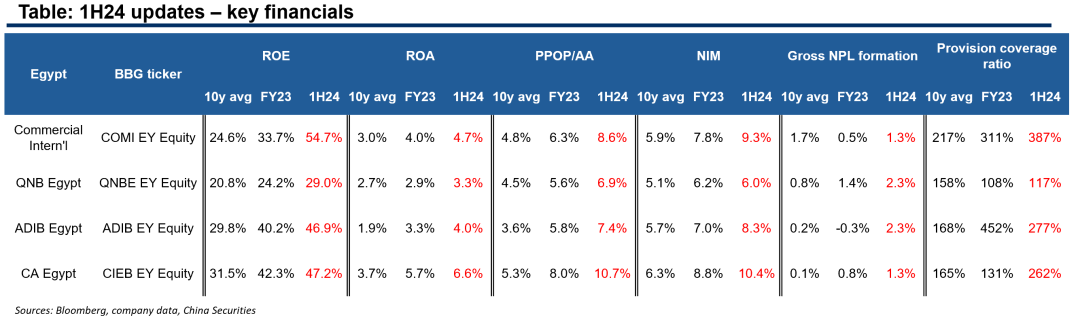
2.4 1H24 updates: key financials
ROE, ROA, PPOP/AA and NIM increased furthermore in 1H24 against the backdrop of high inflation.
Gross NPL formation started to pick up in 1H24 and no unified directions for provision coverage movements.
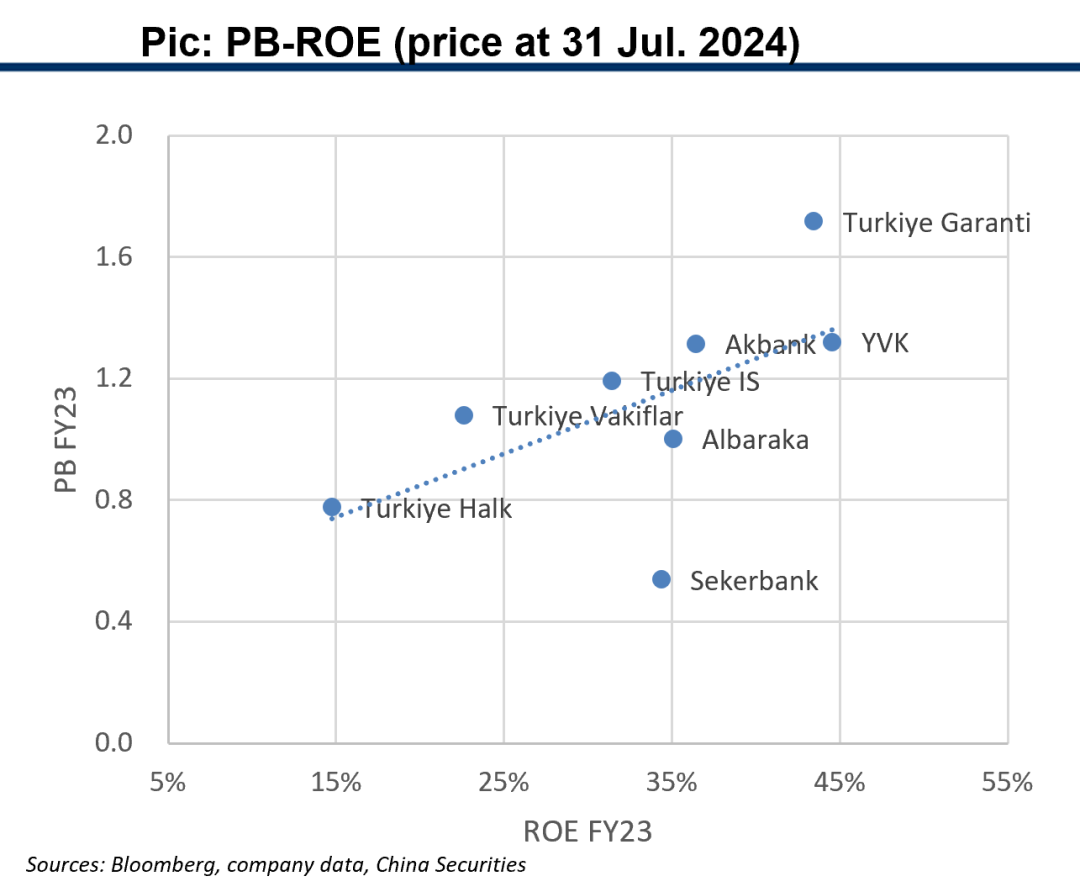
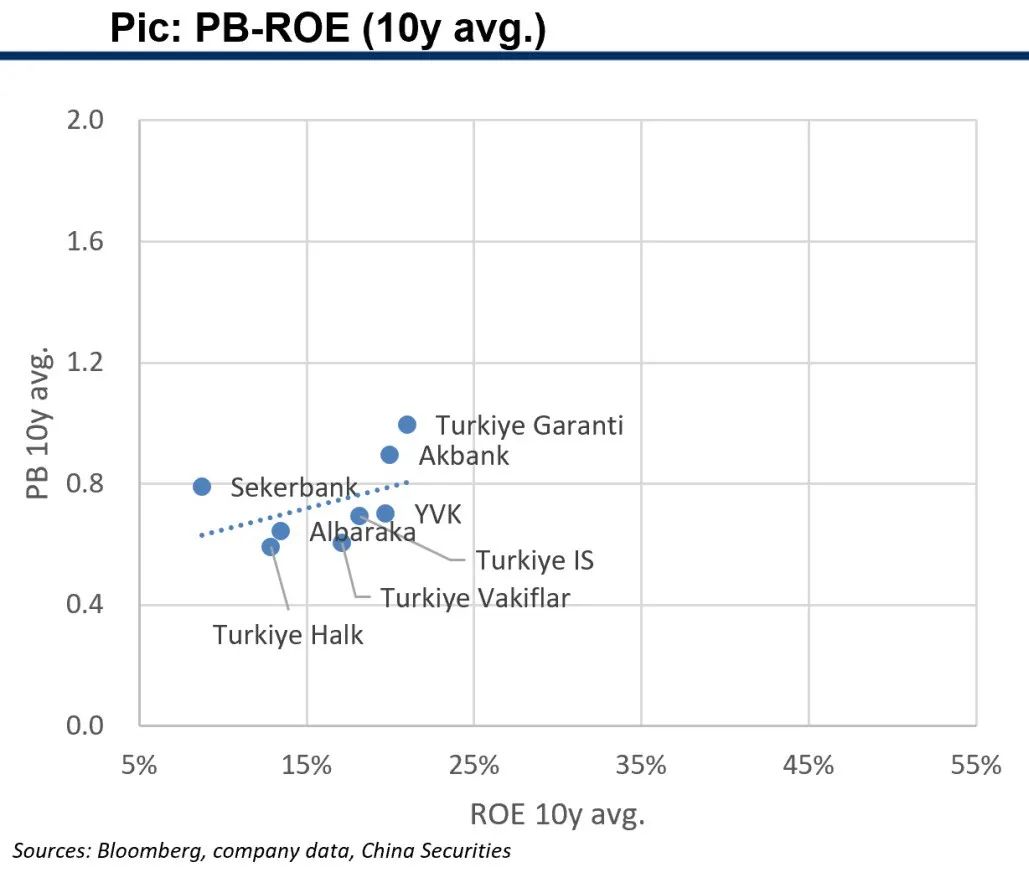
2.5 Turkey: key comp metrics: PB-ROE
Turkey banks realized significant improvements in both ROE and valuation in past 10 years, from a very low starting point with most banks trading below 1x PB.
But current valuations should not be deemed too high no selected banks trading above 2x PB, with the only exception of QNBFB, due to very small free float as it is 99.88% held by QNB.
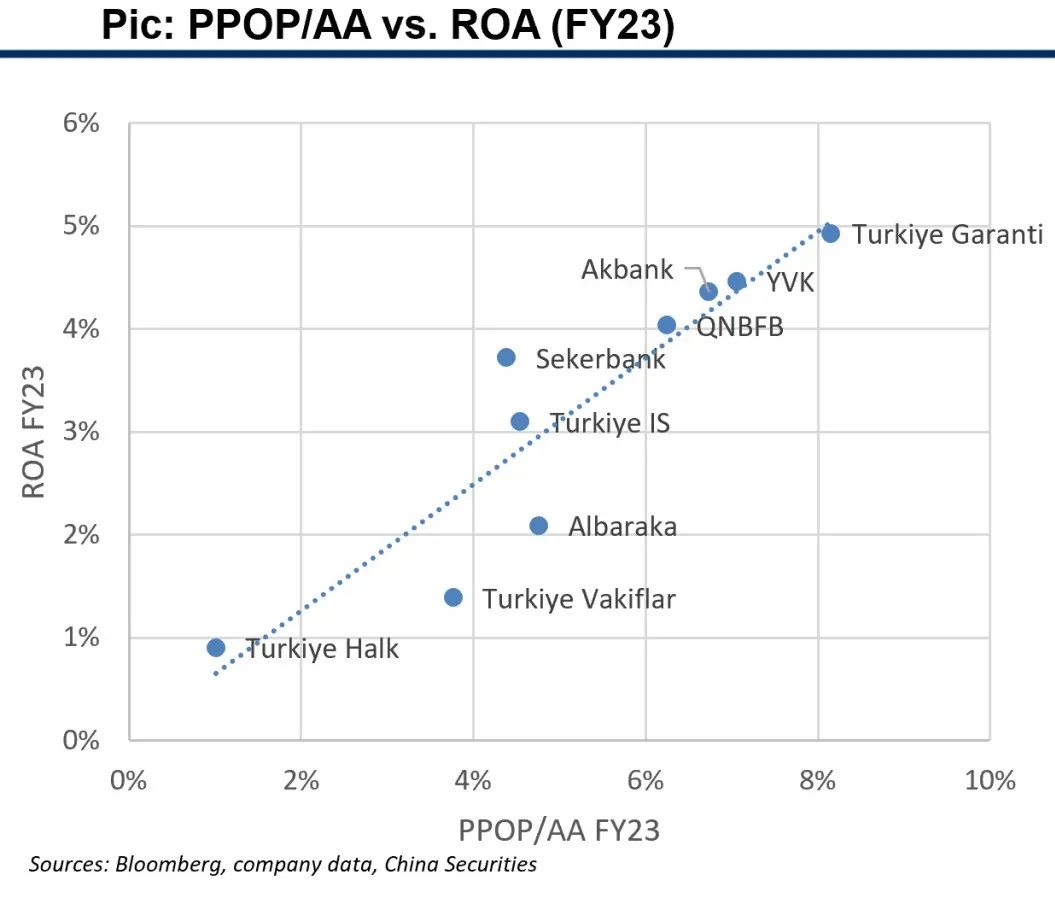
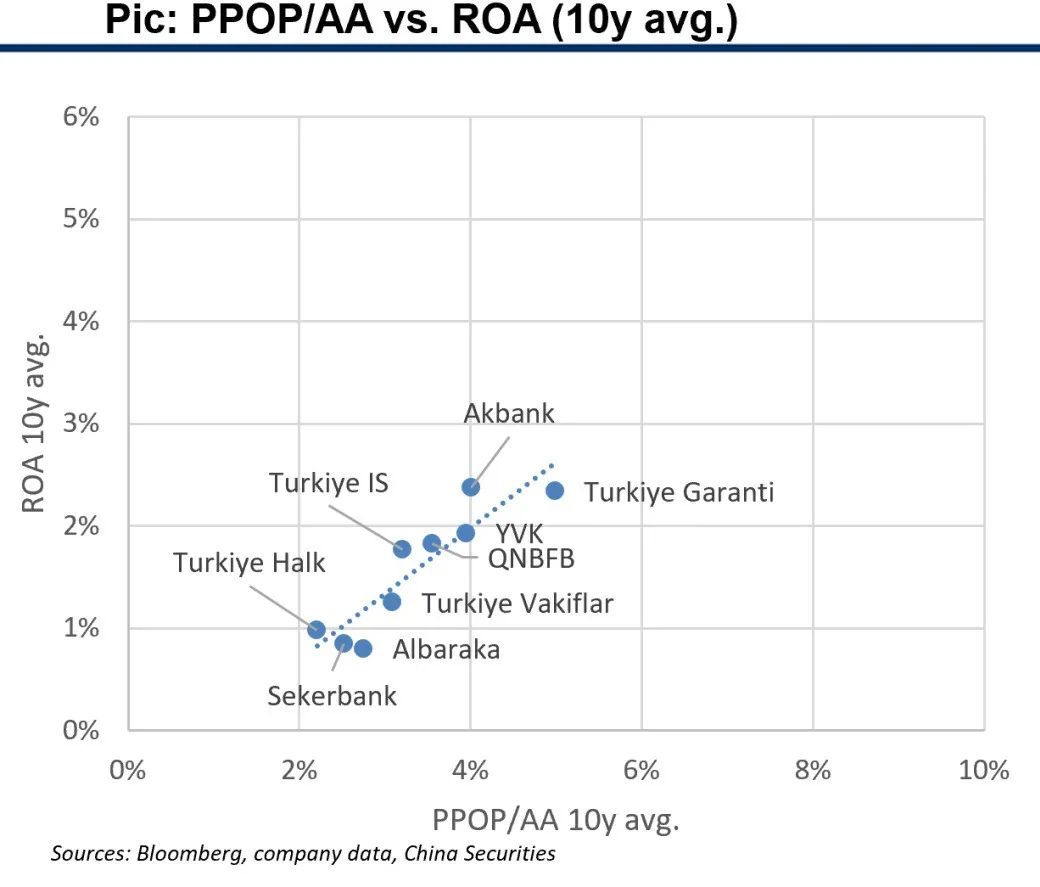
2.5 Turkey: key comp metrics: growth
Both PPOP/AA and ROA of selected Turkey banks expanded remarkably in past 10 years.
Almost all selected Turkey banks were high-growth banks with PPOP/AA>3% in FY23.
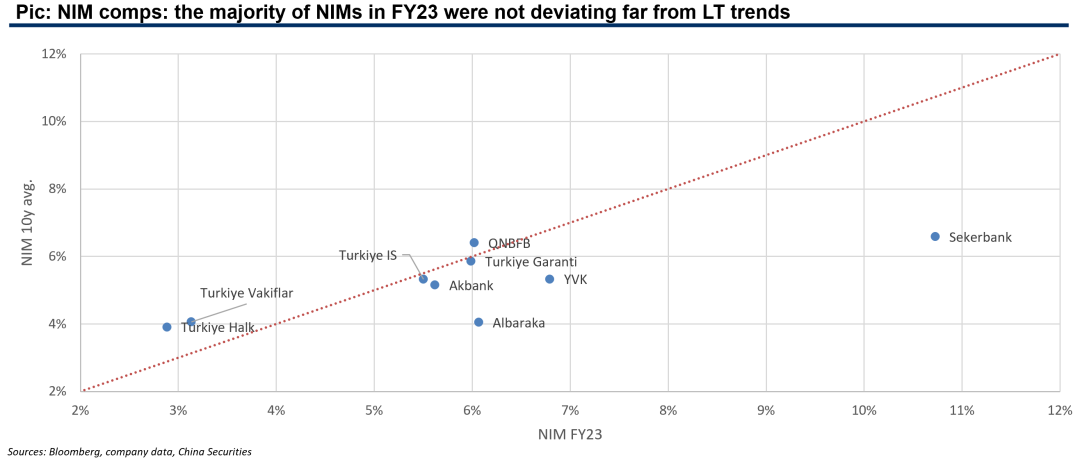
2.5 Turkey: key comp metrics: revenue quality
Pic: NIM comps: the majority of NIMs in FY23 were not deviating far from LT trends
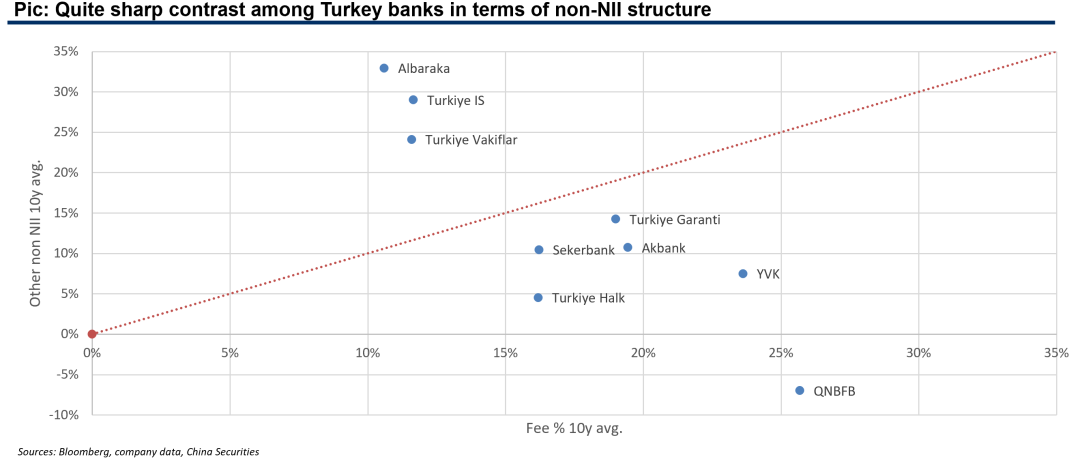
Pic: Quite sharp contrast among Turkey banks in terms of non-NII structure
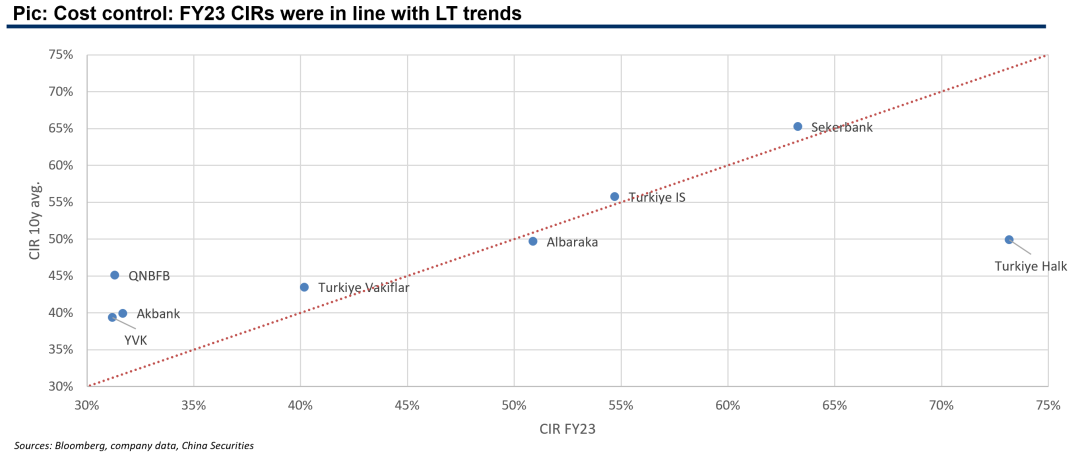
2.5 Turkey: key comp metrics: operational efficiency
Pic: Cost control: FY23 CIRs were in line with LT trends
2.5 Loan pricing and deposit cost
Turkiye Garanti’s andQNBFB are high at lending risk premium and adjusted yield, low at real depositcost and NPL formation, contribute to their leading ROA and ROE.
YVKis high on loan pricing, funding cost and NPL formation, but ROA and ROE arealso good.
Sekerbank ismedium on both loan pricing and funding cost, its risk control is sound withthe lowest NPL formation.
Realdeposit costs do not have clear relationship with CASA ratios. The biggest Turkiye IS ishighest at funding cost.

2.5 Asset quality comps
When judged upon high loan pricing of Turkey banks, gross NPL formation all under 90bps and provision coverage all above 150% are very solid risk control achievements.
Banks with high NIMs and low NPL formations: Sekerbank, Turkiye Garanti, QNBFB.
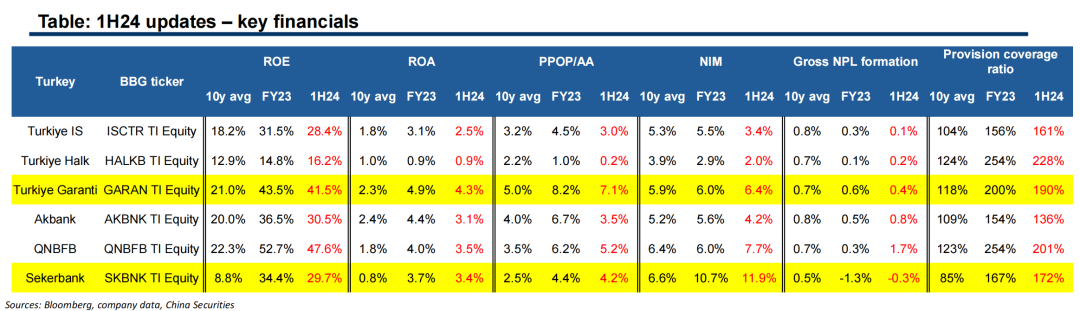
2.5 1H24 updates: key financials
Core earning metrics of ROE, ROA and PPOP/AA softened in 1H24 as compared with FY23 levels.
NIM declined in 1H24 with the exceptions of Turkiye Garanti, QNBFB and Sekerbank.
Provision coverage levels generally maintained as at 1H24.
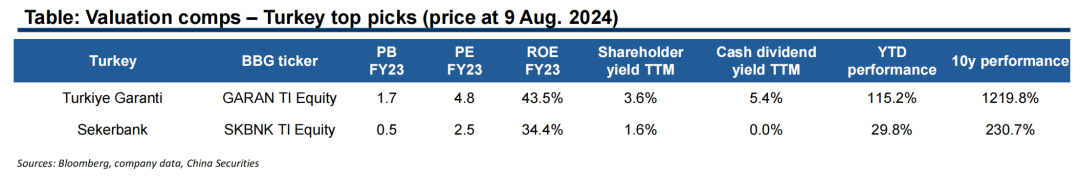
2.5 Top picks: Turkey
Good Turkey banks have rallied quite a lot recently, thus we only list two top picks.
Turkiye Garanti is here because of its leading position in most key financials among Turkey banks.
We list Sekerbank out of its good combination of high NIM and low NPL formation. Its valuation is still very low, we would like to track whether it is a potential mis-pricing here.
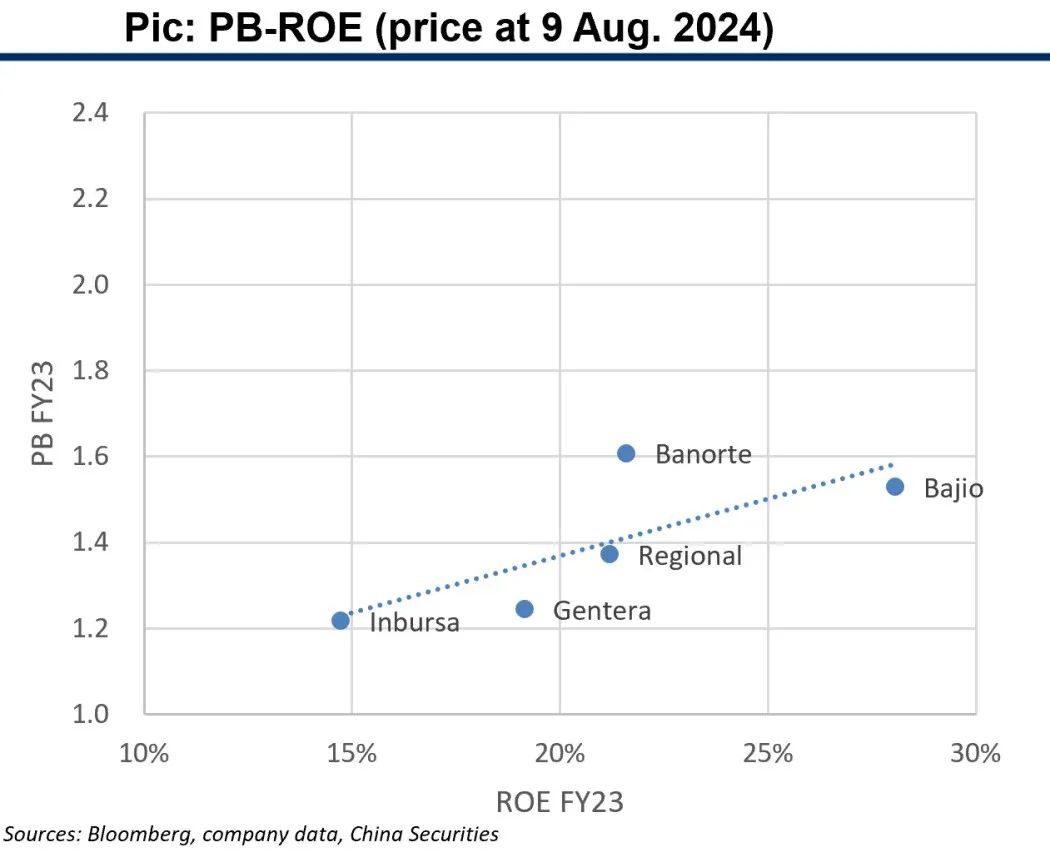
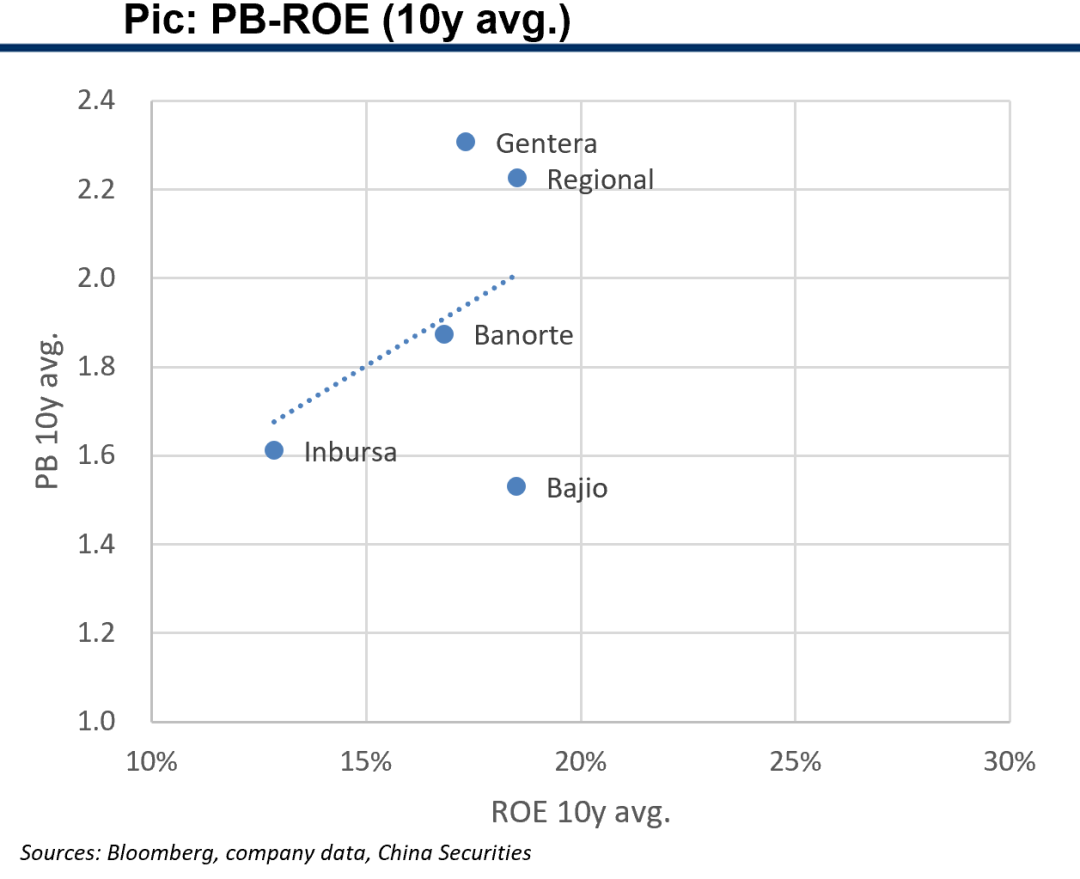
2.6 Mexico: key comp metrics: PB-ROE
Mexico does not have too many listed commercial banks, as foreign banks and unlisted policy banks also play important roles in its financial system. So we only have five banks to analyze.
Their ROEs have increased noticeably in past 10 years, but all valuations have decreased significantly.
Fears on increased competitions from unlisted policy banks, government proposals on stringent regulatory restrictions and unfavorable tax treatments are investors’ major concerns.
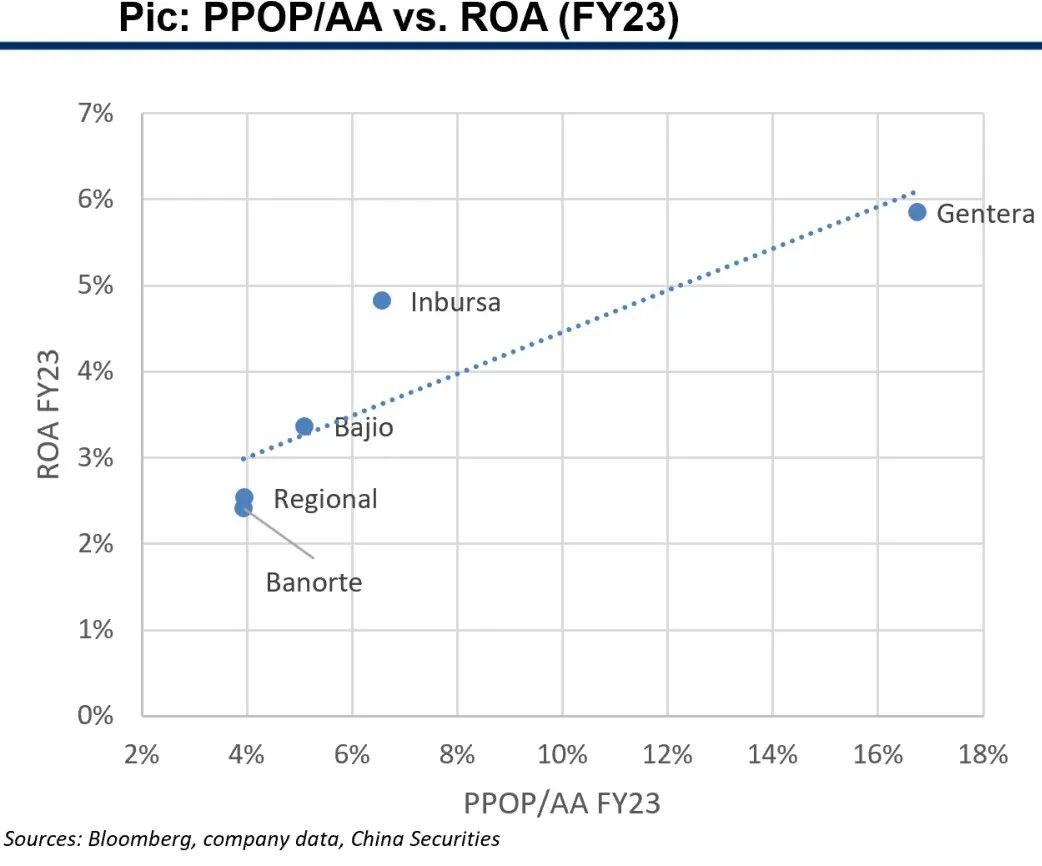
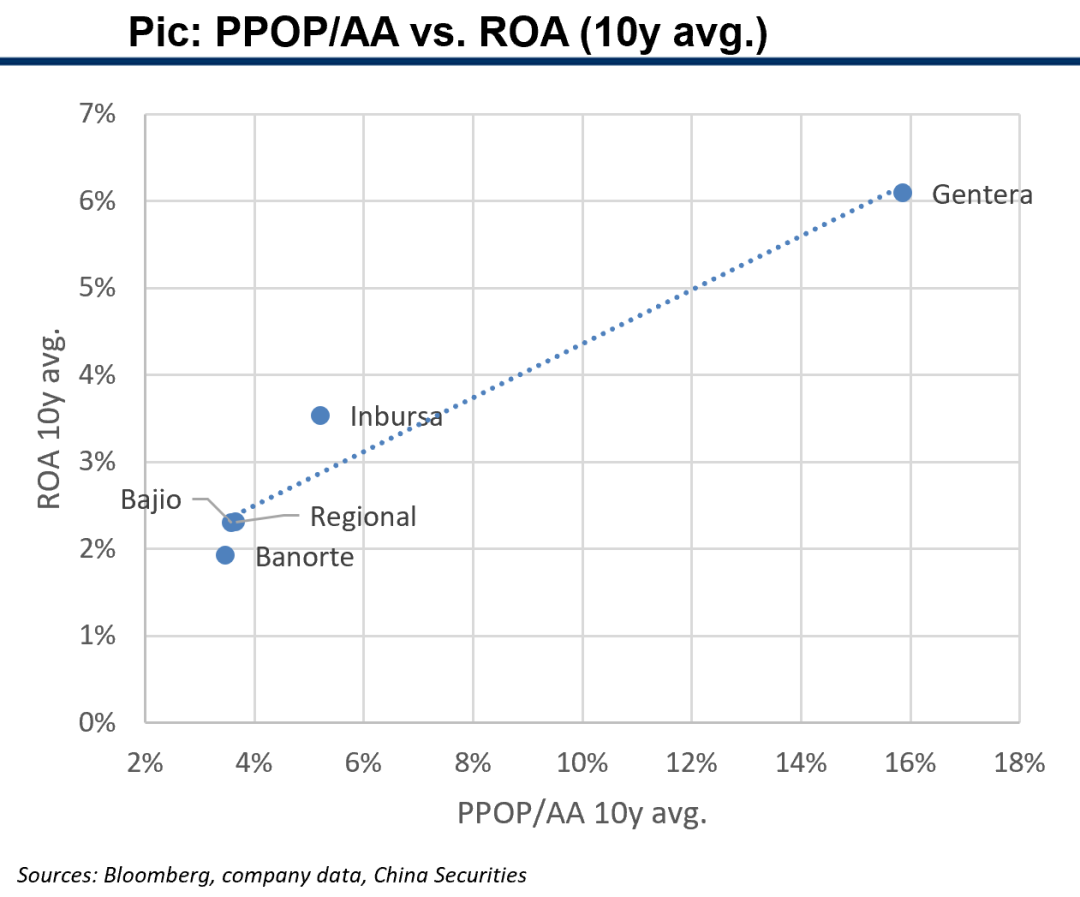
2.6 Mexico: key comp metrics: growth
PPOP/AA and ROA are high for the five Mexico banks, both in FY23 and past 10 years.
The five Mexico banks are all high-growth banks with PPOP/AA>3% in FY23. Gentera has ultra high PPOP/AA and ROA because it is a strong player in micro lending.
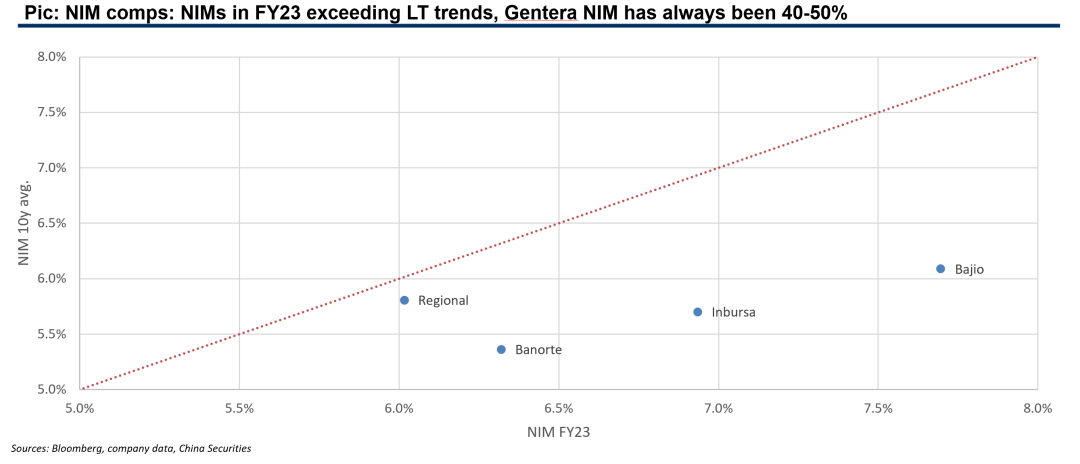
2.6 Mexico: key comp metrics: revenue quality
Pic: NIM comps: NIMs in FY23 exceeding LT trends, Gentera NIM has always been 40-50%
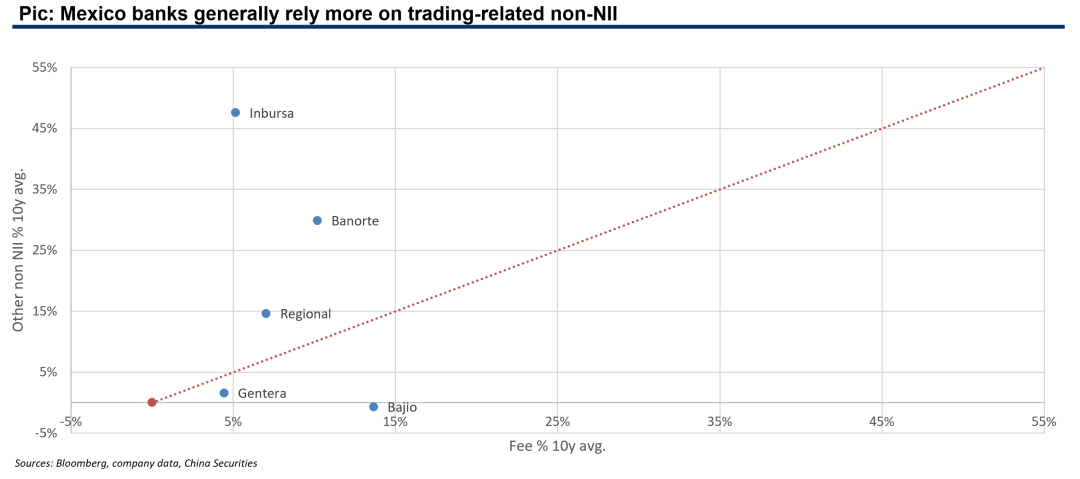
Pic: Mexico banks generally rely more on trading-related non-NII
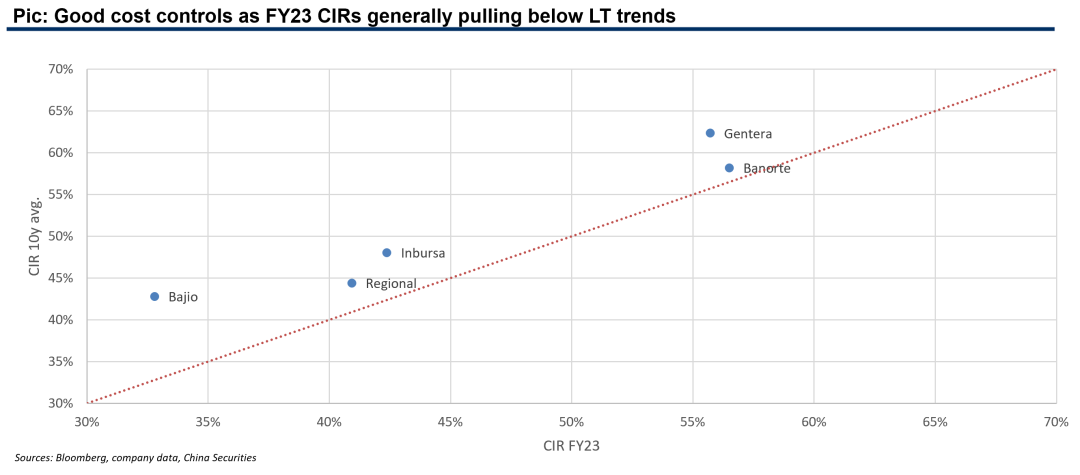
2.6 Mexico: key comp metrics: operational efficiency
Pic: Good cost controls as FY23 CIRs generally pulling below LT trends
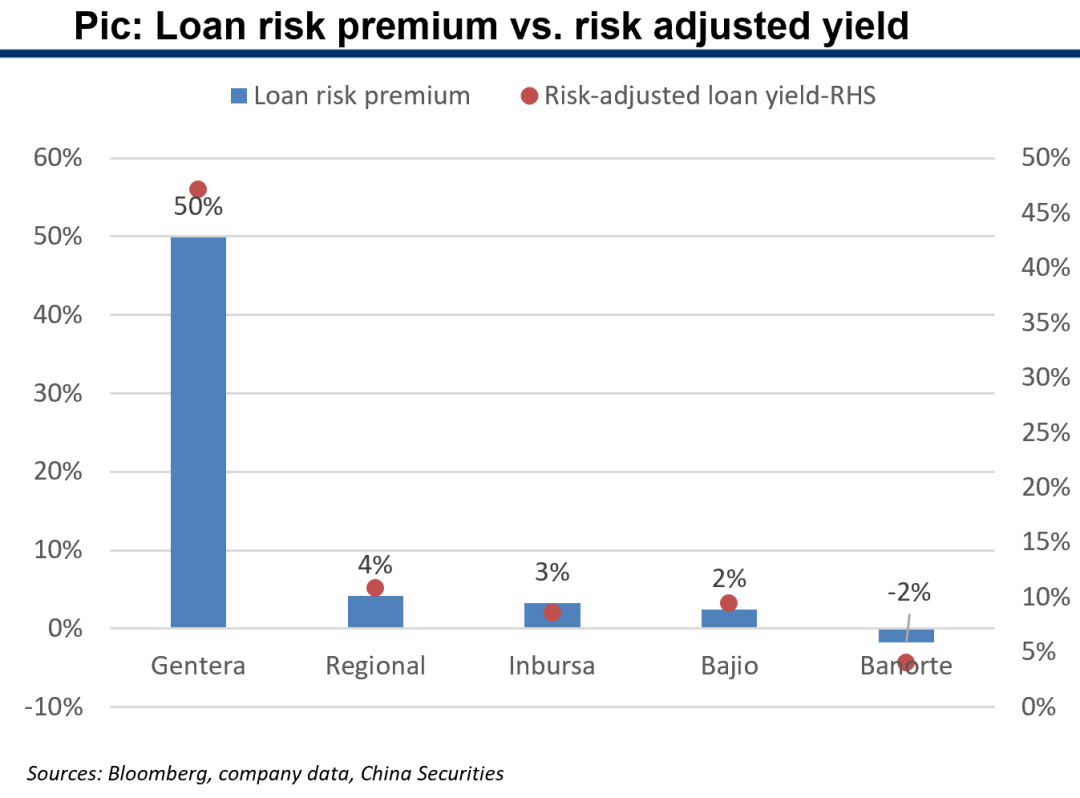
2.6 Loan pricing and deposit cost
Gentera is in micro lending business so its loan pricing is not comparable with other traditional banks.
Inbursa’s good risk control results in low formations and high risk-adjusted yield, and it has the lowest deposit cost.
Baijo is low at lending price, funding cost and NPL formation. uBanorte’s lending risk premium is the lowest and negative, albeit its NPL formation is the highest.
Low loan pricing does not necessarily yield low risks, with Regional as another example.
2.6 Asset quality comps
Risk and provisioning strategies of the five Mexico banks have quite sharp differences.
Bajio, Inbursa, Gentera have better risk pricing power given their high NIMs and low NPL formations.
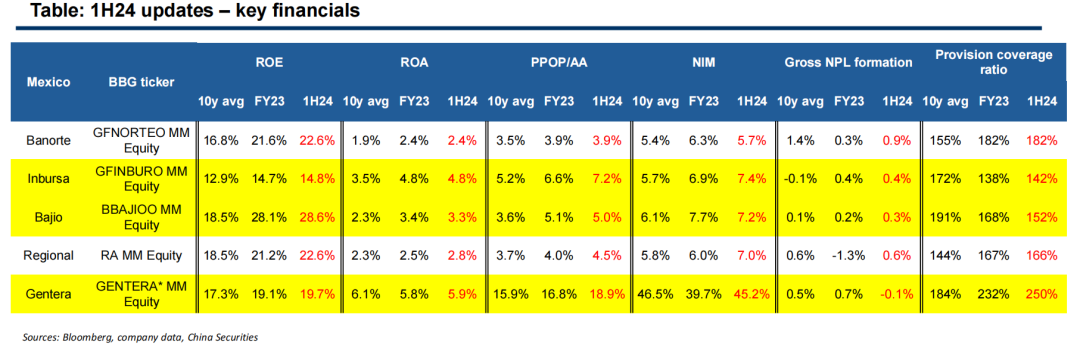
2.6 1H24 updates: key financials
Coreearning metrics of ROE, ROA and PPOP/AA maintained or inched up further in1H24.
NIMgenerally improved in 1H24.
GrossNPL formation rebounded from FY23 levels and provision coverage kept stable
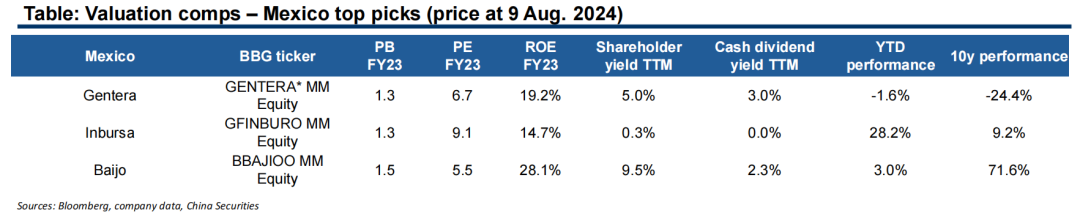
2.6 Top picks: Mexico
Gentera is listed because of its strong micro lending business and sky-rocketing NIM, PPOP/AA and ROA.
We list Inbursa and Baijo due to their good combination of high NIM and low NPL formation.
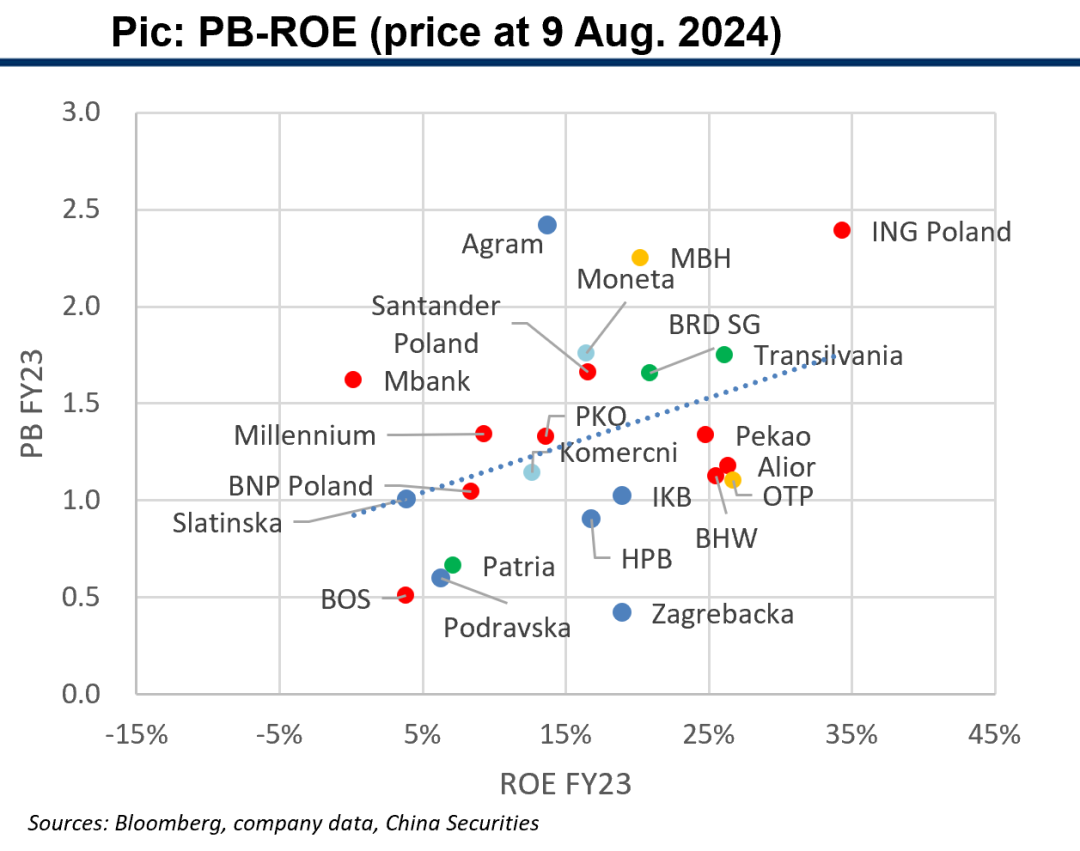
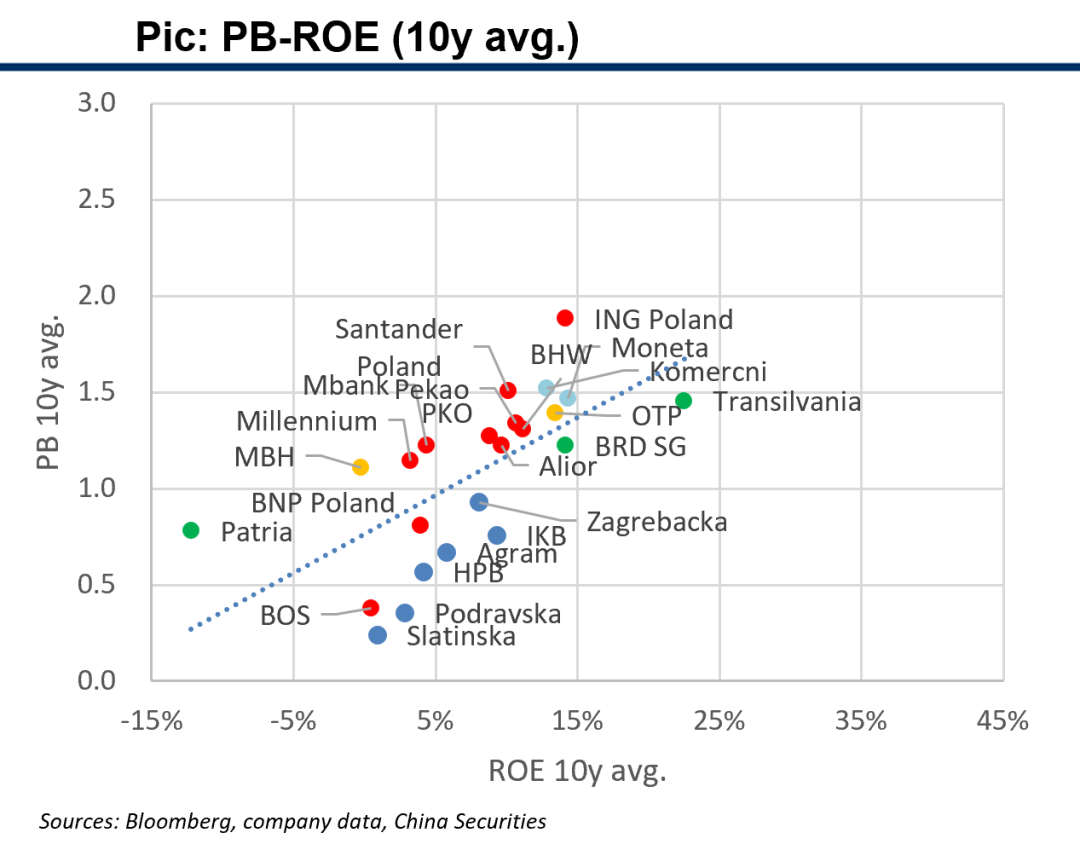
2.7 Eastern Europe: key comp metrics: PB-ROE
According to relative size and recent growth trend of each country, we select banks from Poland (red dots in scatter plots), Hungary (yellow), Czech (light blue), Romania (green), Croatia (blue) in Eastern Europe.
The great majority of banks in Eastern Europe achieved both ROE and valuation enhancements in past 10 years.
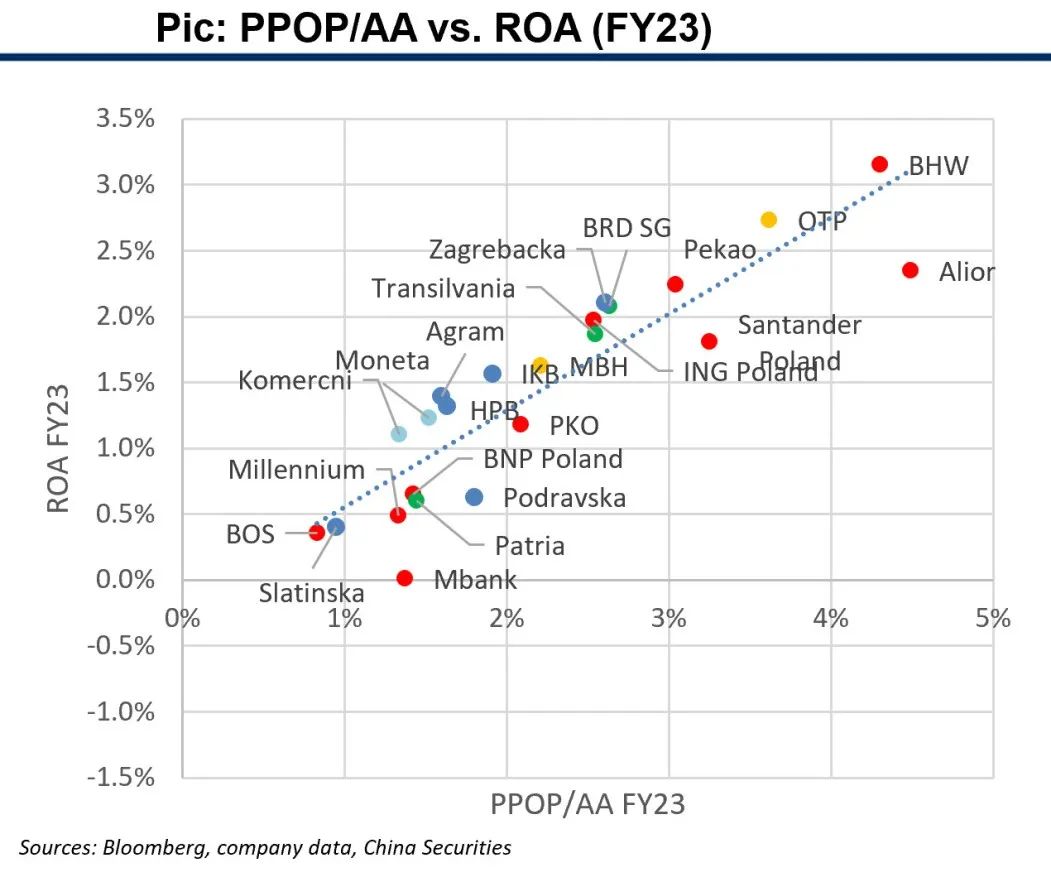
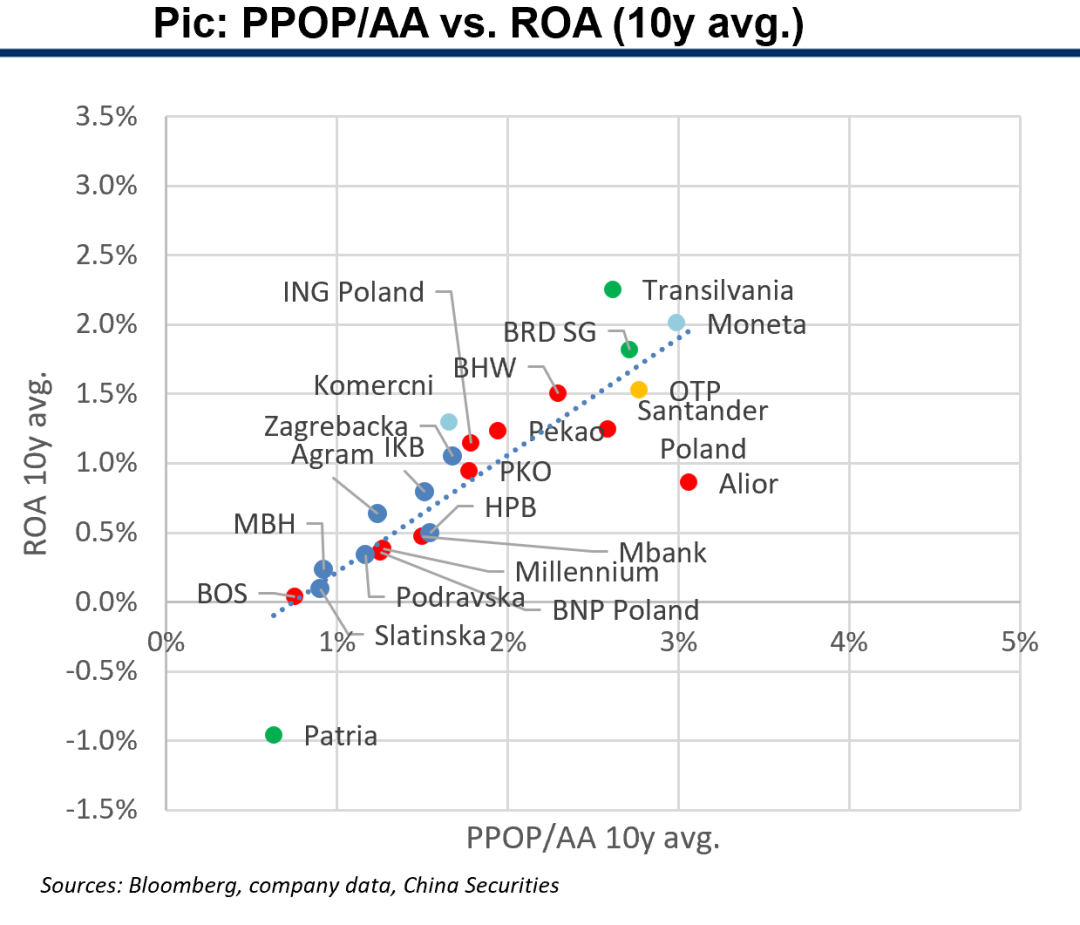
2.7 EasternEurope:key comp metrics: growth
Core earnings power as measured by PPOP/AA and ROA for Eastern Europe banks improved in past 10 years.
Poland and Hungary have most high-growth banks with PPOP/AA>3%.
Several Romania and Croatia banks fall into the good-growth group with PPOP/AA>2%.
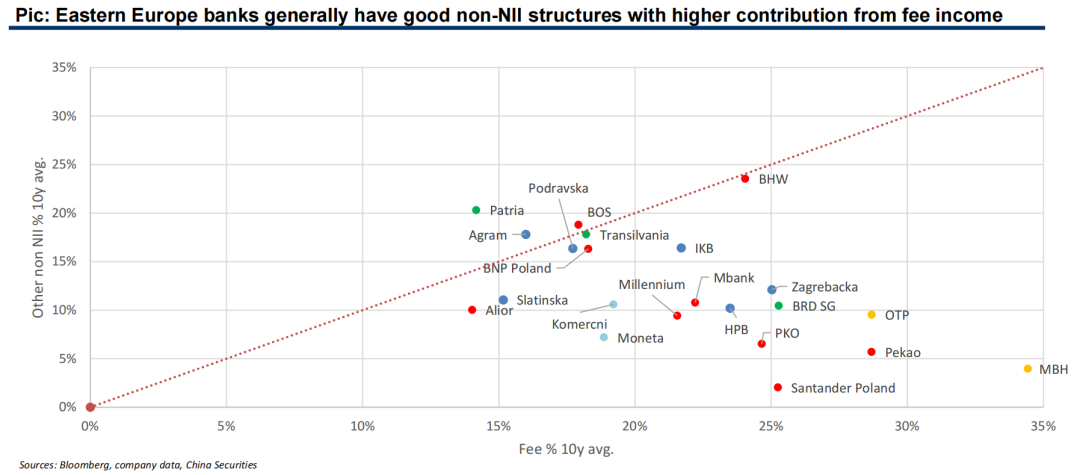
2.7 EasternEurope:key comp metrics: revenue quality
Pic: NIM comps: the great majority exceeding LT NIM trends in FY23, with the only exception of Czech
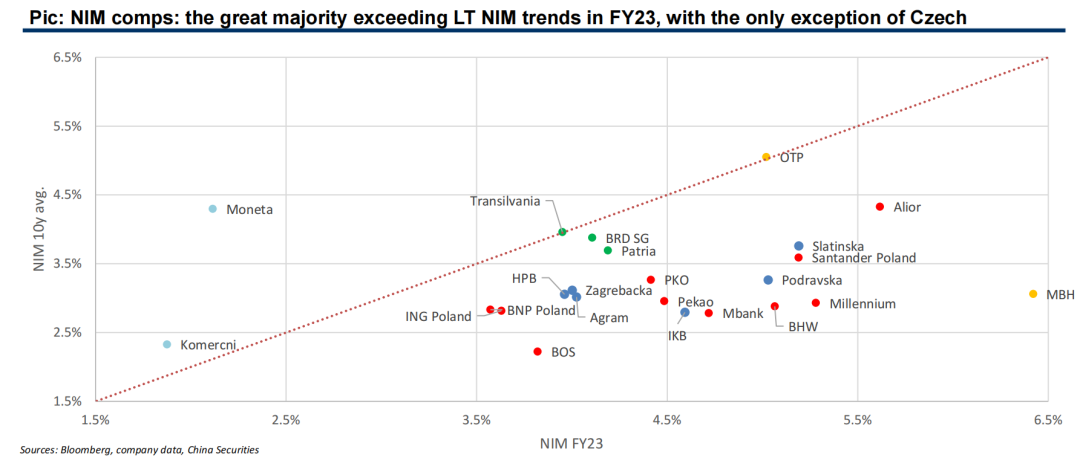
Pic: Eastern Europe banks generally have good non-NII structures with higher contribution from fee income
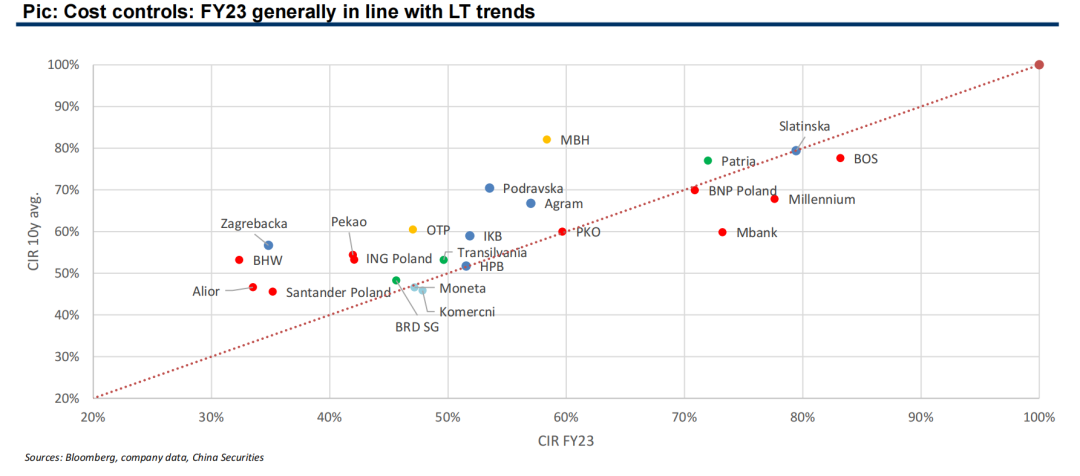
2.7 Eastern Europe: key comp metrics: operational efficiency
Pic: Cost controls: FY23 generally in line with LT trends
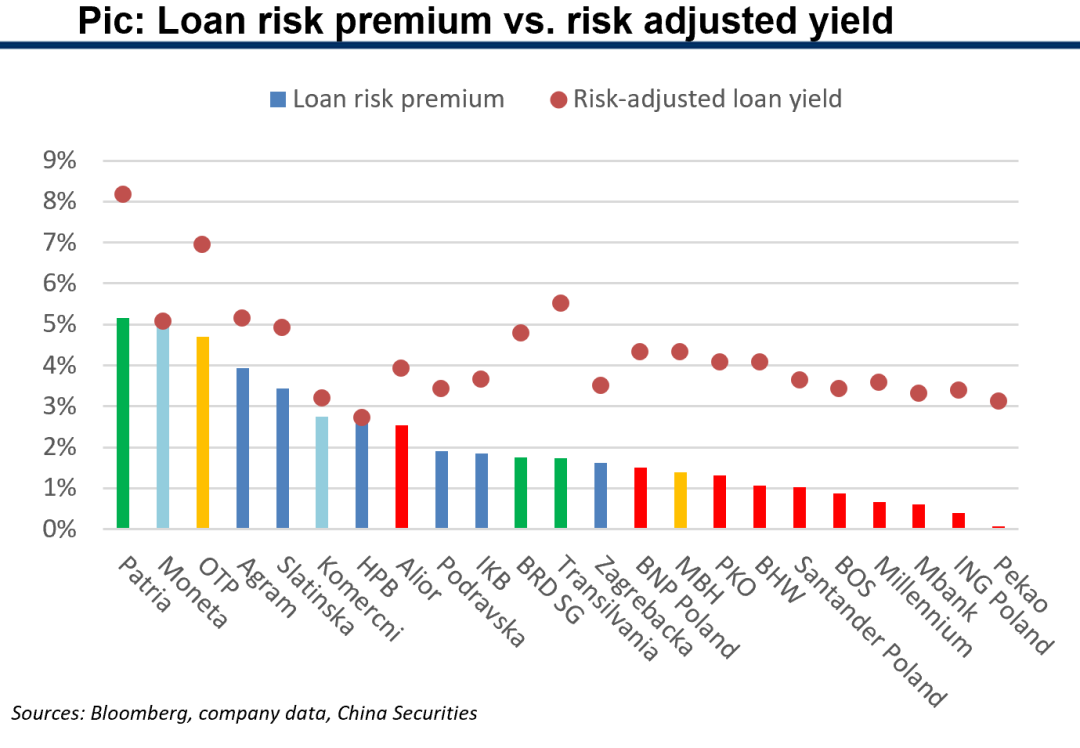
2.7 Loan pricing and deposit cost
Loan risk premiums and real deposit rates have clear country features, as well as operational advantages among banks within the same country.
Banks with high loan pricing, low deposit cost and good NPL formation: OTP (Hungary), Patria (Romania).
Some banks are low deposit cost and low loan pricing mode, with low NPL formation: BRD SG (Romania), MBH (Hungary), PKO, BHW and Pekao (Poland).
High loan pricing sometimes is with high NPL formation: Transilvania (Romania), Agram and Slatinska (Croatia).
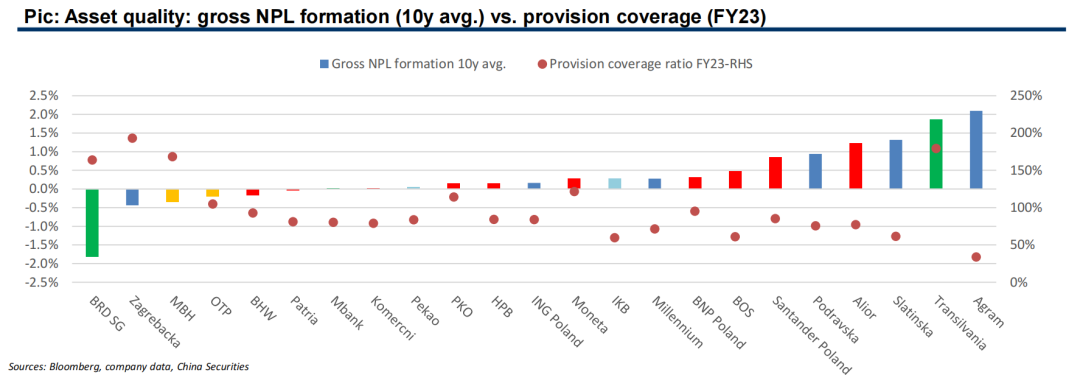
2.7 Asset quality comps
The majority of banks in Eastern Europe have good combinations of NPL formation and NIM, provision strategies are like most European banks, enough is enough.
Banks best of high NIMs and low NPL formations: OTP (Hungary), Patria and BRD SG (Romania).
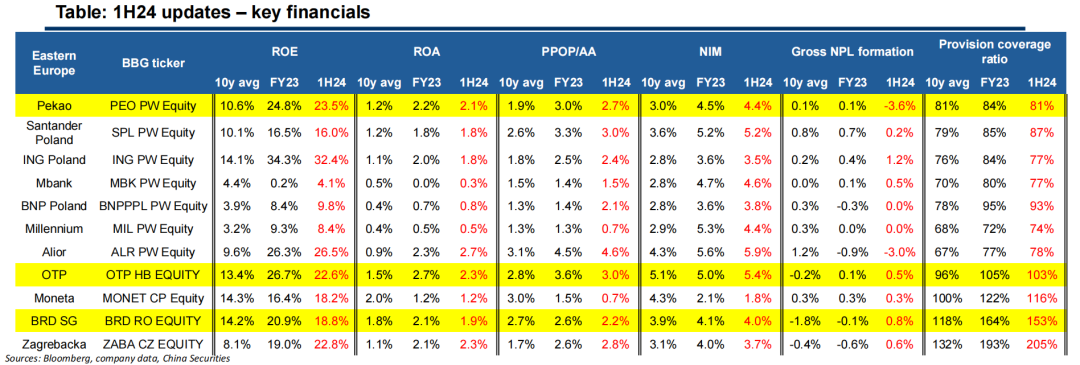
2.7 1H24 updates: key financials
Core earning metrics of ROE, ROA and PPOP/AA generally maintained at FY23 levels in 1H24.
NIM maintained or inched up further in 1H24.
Gross NPL rebounded from very low levels of FY23 and provision coverage kept stable.
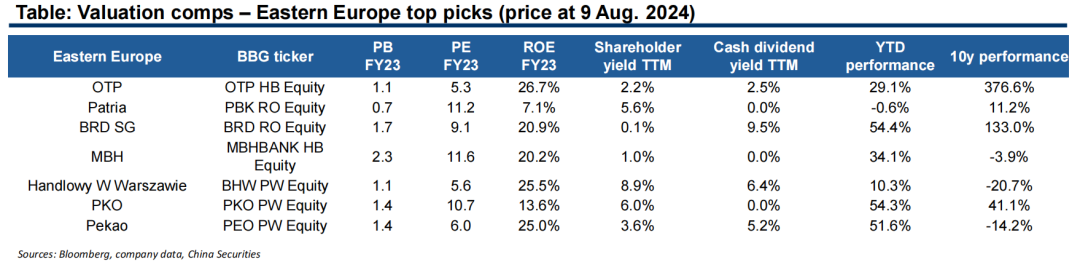
2.7 Top picks: Eastern Europe
OTP is a clear leader among Eastern Europe banks in most important financials like ROE/ROA, PPOP/AA, NIM, fee contribution and risk control.
The other six banks are listed mainly due to their good combination of good NIM (either from asset or liability side) and low NPL formation. Their ROE and core growth power are also among the highest.
Ⅲ
Dividend markets: a bottom-up approach
3. Dividend markets: a comparison of yields and ranking-based selection
We define regions with banks of low to medium growth and ROE, but high and stable payout and dividend yield as dividend markets. Payout ability and sustainability are the key factors for us to pick banks in these regions.
Dividend markets in our sample are Australia, Canada, UK, Western Europe, Chile, South Korea, Hong Kong and Singapore, Japan.
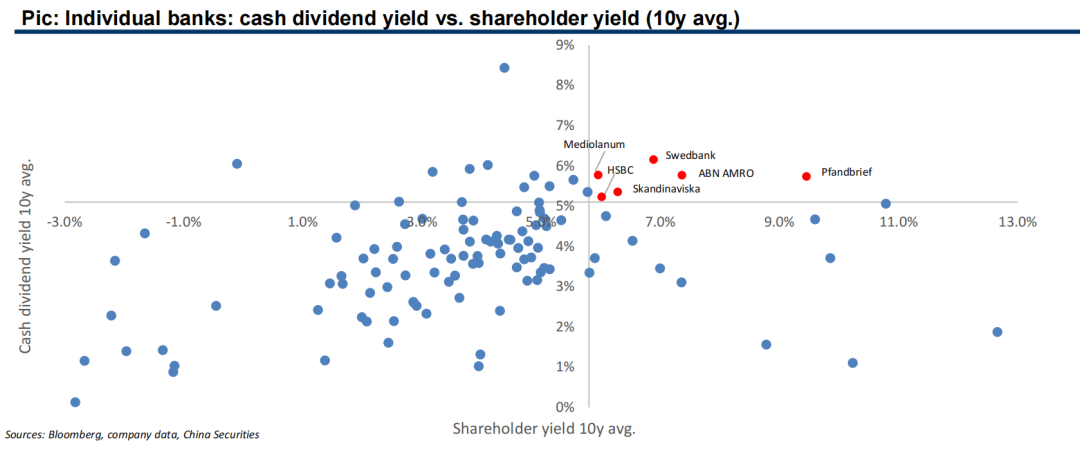
3. Top 15% for both dividend yield and shareholder yield
When comparing cash dividend yield and shareholder yield of the 114 banks from dividend markets, we aim to pick out banks high at both yields. So we cross the two axis of the following diagram at the top 15% of each other.
6 banks stand out for both yields achieving top 15% among all banks from dividend markets, on a 10-year horizon: Pfandbrief (Germany), ABN AMRO (Netherlands), Swedbank (Sweden), Skandinaviska (Sweden), HSBC (UK), Mediolanum (Italy).
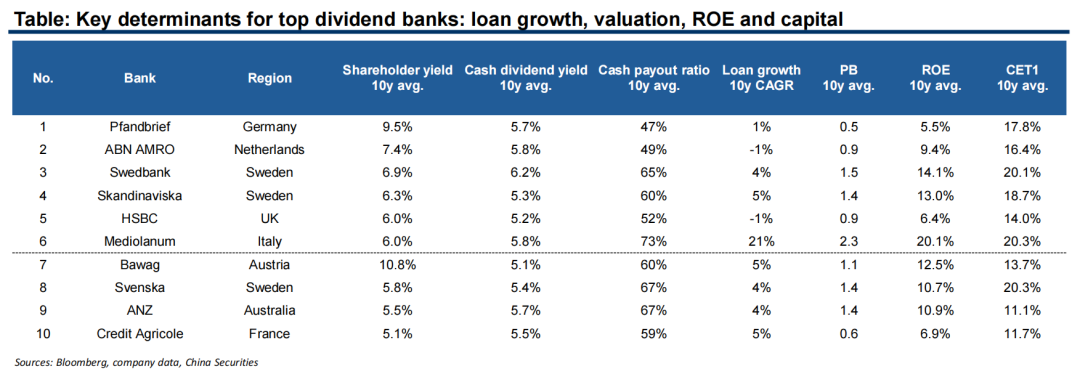
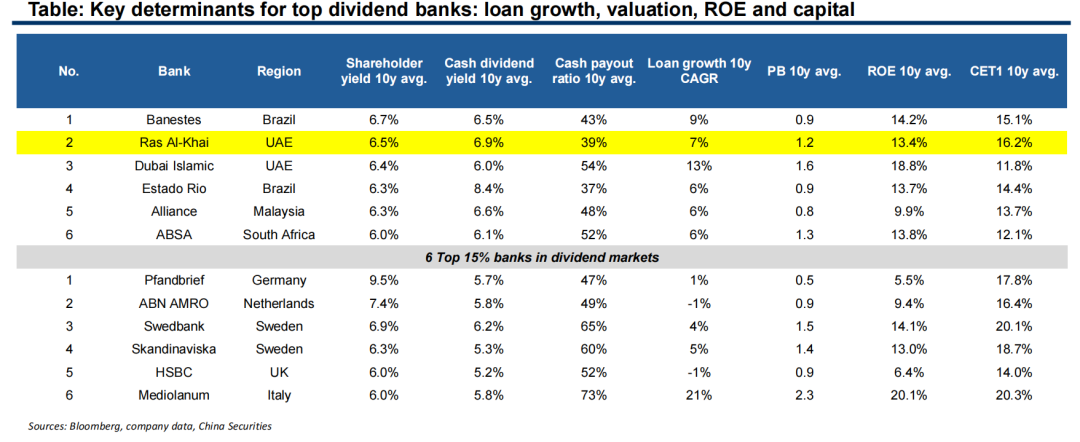
3. Key determinants for the top dividend banks
We also include 4 more banks at the end of the table, which are the top 15-20% banks in the comps before.
All 10 banks have similar characteristics of very slow loan growth medium to high ROEs and sufficient capital levels to support long-term generous returns to shareholders.
With the only exception of Mediolanum, which is a bank but also the biggest asset manager in Italy and therefore high contributions of net fee income. Its high dividend and shareholder yields are achieved in a slightly different way than the other 9 banks .
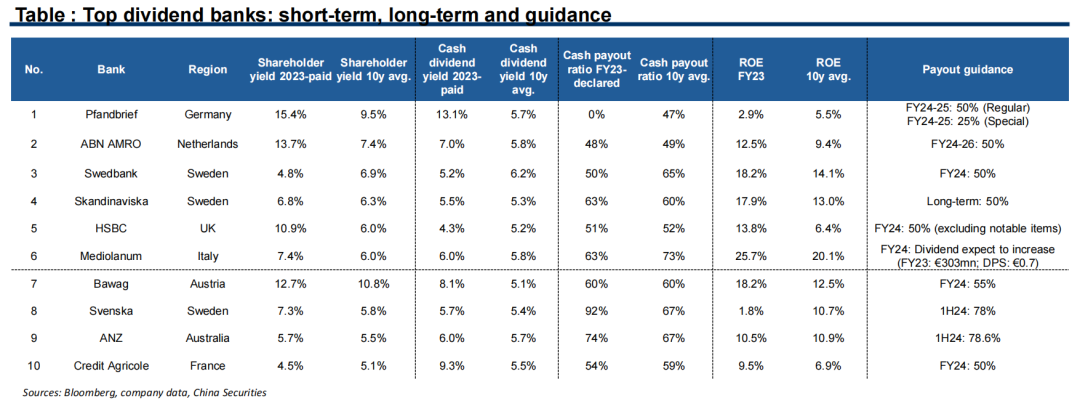
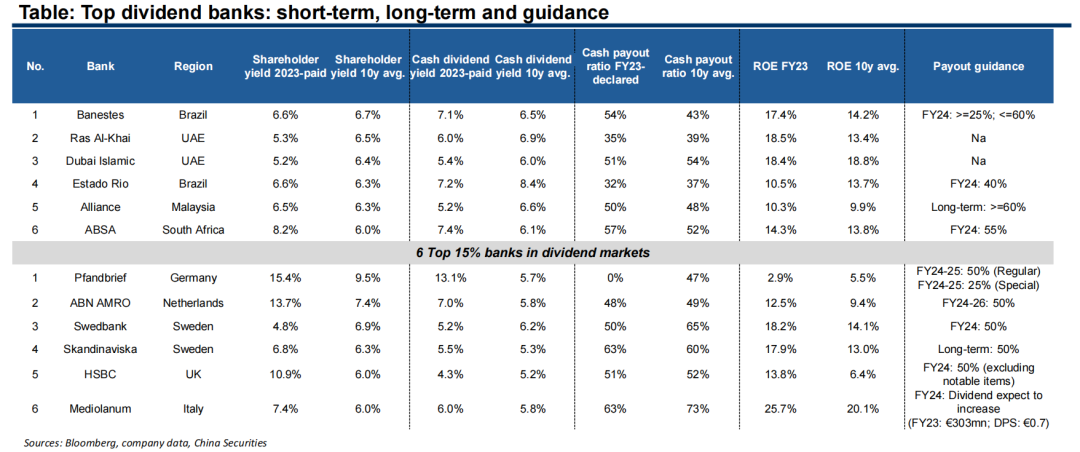
3. A further look on current trend and guidance
We are more comfortable to see ST FY23 numbers of shareholder and dividend yields, payout and ROE are in line or better than the 10y avg. LT trends. Guidance is also generally positive, for those with formal guidance disclosures.
Pfandbrief suspended its FY23 cash payout due to concerns over American CRE business. But we maintain our confidence on it because of its strong guidance that a payout of 50% as a regular dividend and 25% as a special dividend until 2025 financial year.
Ⅳ
Balanced markets: high-growth anddividend picks
4. Balanced markets: definition and approach
Balanced markets usually have a large number of good-growth banks with 2-3% LT PPOP/AA, but very few of which could maintain above the 3% threshold for high-growth in the long run.
But unlike high-growth banks in growth markets discussed before which are usually poor at dividend, many good-growth banks in balanced markets have attractive dividend yields and sound payout track records.
Therefore, we pick out high-growth and high-dividend banks from balanced markets on a direct bottom-up approach.
We label the following regions as balanced markets: US, Brazil, Saudi, UAE, Qatar, Malaysia, South Africa.

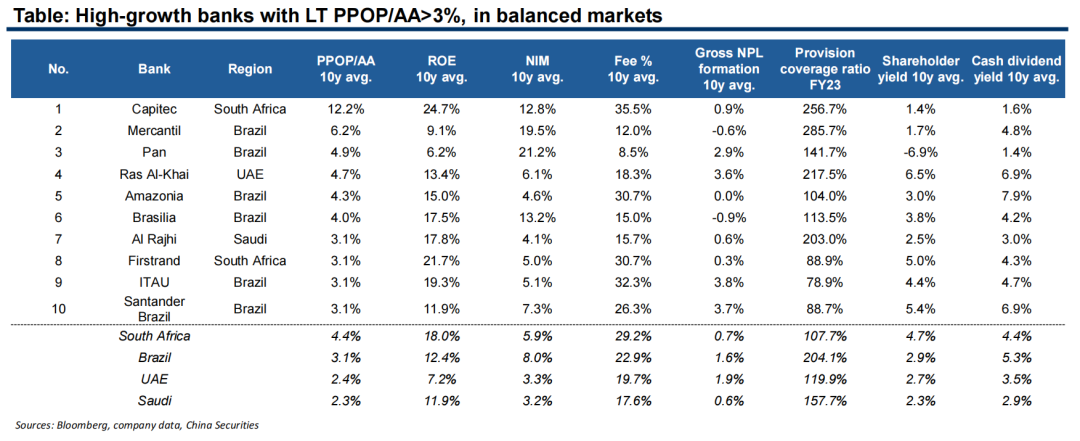
4. High-growth banks in balanced markets
10 banks from South Africa, Brazil, UAE and Saudi have exceeded the high-growth threshold in the long run.
They all have outstanding NIM levels and healthy fee contributions. Asset quality performances vary across regions, but within the same region, NPL formation and provision styles are similar.
Some of them also have sound shareholder and dividend yields, besides growth.
4. Dividend banks in balanced markets
6 banks are ranked top 15% on both cash dividend and shareholder yields, on a 10-year view, which are Banestes, and Estado Rio from Brazil, Ras Al-Khai and Dubai Islamic from UAE, Alliance from Malaysia, ABSA from South Africa.
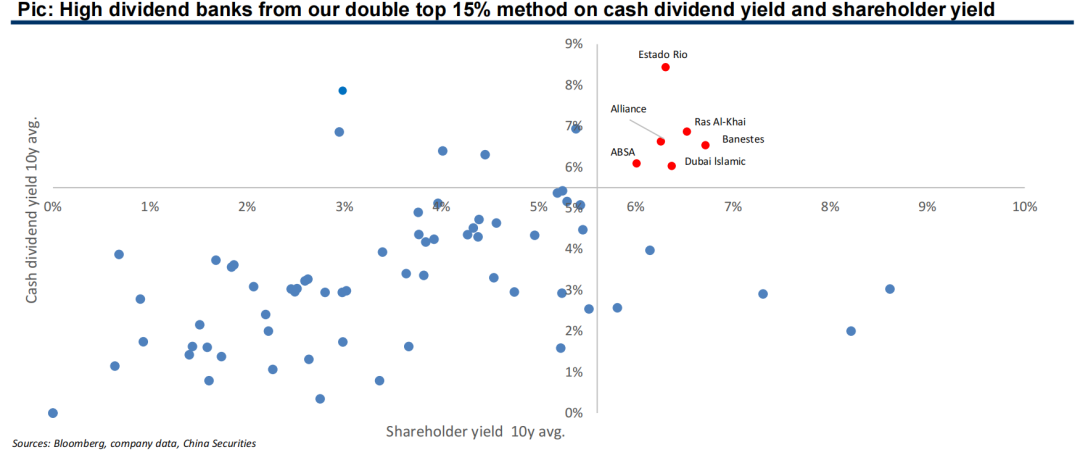
Both yields of top banks in balanced markets are not lower than top banks in dividend markets, due to higher ROEs and more reasonable valuations in general.
Ras Al-Khai stands out in both high-growth and high dividend banks.
4. Dividend banks in balanced markets
ST and LT trends regarding payout and ROE are generally in line, guidance is also positive.
Ⅴ
Some cross-overs: high-growth andpositive guidance in dividend markets
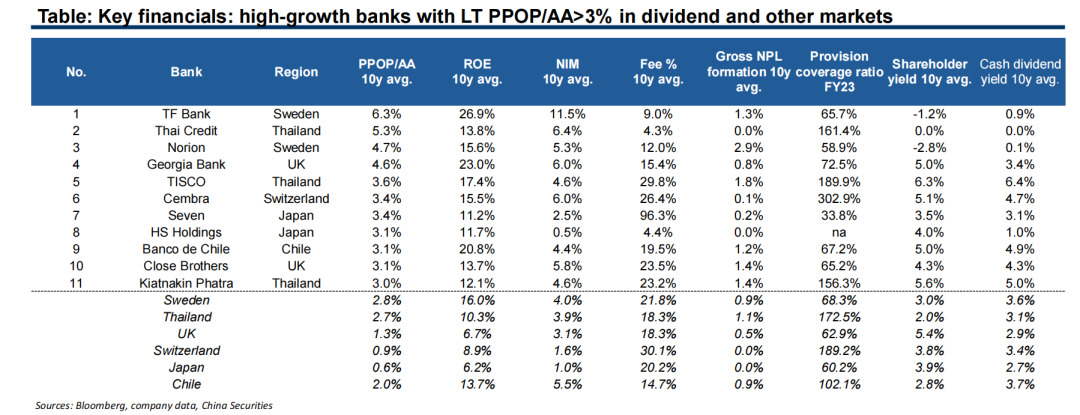
5. Moreover, high growth banks in dividend and other markets
High-growth banks do not only exist in growth and balanced markets. There are also high-growth banks in dividend markets, which far exceeding the average growth trajectory of their home markets and comparable with peers from growth and balanced markets. They usually have special business models, operating regions or unique governance structures to greatly outpace local peers.
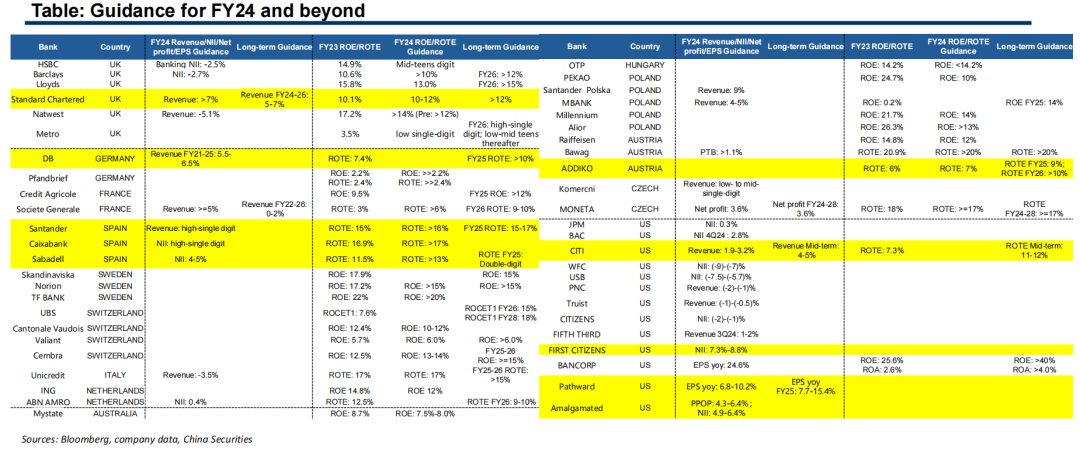
5. Finally, banks with positive guidance in dividend & balancedmarkets
We list guidance of banks in UK, Europe, US and Australia as follows. Out of the total number of 136 banks we sampled in these regions, only 48 give explicit official guidance.
Banks with upward guidance in either FY24 or LT revenue/NII, FY24 or LT ROE/ROTE are highlighted in yellow.
Ⅵ
Final top-pick list and two more issues: valuation andFX
6. Global Banking Research: top picks
Please refer to our report for Final top-pick list and valuation related content.
7. Risks
Worse-than-expected global economic recessions.
Return to zero-rate environment globally.
Unexpected global geo-political tensions and risks.
Further regulatory pressures.
All the risks above could have an adverse impact on NPL formation and capital position.
报告信息
证券研究报告名称:《Global Banking Research: A first look at country specifics & stock picks》
对外发布时间:2024年8月22日
报告发布机构:中信建投证券股份有限公司
本报告分析师:
【马鲲鹏(金麒麟分析师)】SAC 执证编号:S1440521060001
【李 晨】SAC 执证编号:S1440521060002
研究助理:
【王欣宇】
【刘子健】
免责声明
本订阅号所载内容仅面向符合《证券期货投资者适当性管理办法》规定的机构类专业投资者。中信建投不因任何订阅或接收本订阅号内容的行为而将订阅人视为中信建投的客户。
本订阅号不是中信建投研究报告的发布平台,所载内容均来自于中信建投已正式发布的研究报告或对报告进行的跟踪与解读,订阅者若使用所载资料,有可能会因缺乏对完整报告的了解而对其中关键假设、评级、目标价等内容产生误解。提请订阅者参阅中信建投已发布的完整证券研究报告,仔细阅读其所附各项声明、信息披露事项及风险提示,关注相关的分析、预测能够成立的关键假设条件,关注投资评级和证券目标价格的预测时间周期,并准确理解投资评级的含义。
中信建投对本订阅号所载资料的准确性、可靠性、时效性及完整性不作任何明示或暗示的保证。本订阅号中资料、意见等仅代表来源证券研究报告发布当日的判断,相关研究观点可依据中信建投后续发布的证券研究报告在不发布通知的情形下作出更改。中信建投的销售人员、交易人员以及其他专业人士可能会依据不同假设和标准、采用不同的分析方法而口头或书面发表与本订阅号中资料意见不一致的市场评论和/或观点。
本订阅号发布的内容并非投资决策服务,在任何情形下都不构成对接收本订阅号内容受众的任何投资建议。订阅者应当充分了解各类投资风险,根据自身情况自主做出投资决策并自行承担投资风险。订阅者根据本订阅号内容做出的任何决策与中信建投或相关作者无关。
本订阅号发布的内容仅为中信建投所有。未经中信建投事先书面许可(金麒麟分析师),任何机构和/或个人不得以任何形式转发、翻版、复制、发布或引用本订阅号发布的全部或部分内容,亦不得从未经中信建投书面授权的任何机构、个人或其运营的媒体平台接收、翻版、复制或引用本订阅号发布的全部或部分内容。版权所有,违者必究。
(转自:大金融研究)